1 / 15
AI Engineer & Software/Data Engineer | Aviation Enthusiast | Production LLM & Data Systems | Runner
⚠️ Due to high operating costs, HoodaAgents is currently available by request only.
I'm a 24-year-old AI & Software/Data Engineer who builds production systems — the kind with rate limiters, kill switches, retries and real traffic, not the kind that lives in a notebook. I hold a BS in Computer Science from UT Dallas and certifications in IBM AI Engineering, IBM Data Science, and the Databricks Certified Data Engineer Associate.
My work spans both halves of the stack: designing and optimizing end-to-end data pipelines across Microsoft Fabric, Databricks, PySpark and SQL, and shipping full-stack AI systems — multi-model LLM gateways, hybrid RAG with reranking, agentic loops, and offline eval harnesses. This site is one of them. It runs a hybrid retrieval pipeline, a gateway across five model providers, and a seven-layer security stack that has taken sustained real attack traffic and held.
Most of my side projects live where messy public data meets automation. ClimatePulse is a 57-year NOAA pipeline across 13 global stations with a Bronze→Silver→Gold architecture, refreshed daily by GitHub Actions — incremental per-station caching cut each run from 741 API calls to 13. The live flight tracker on this page is real-time geospatial ingestion. mcp-garmin came from reverse-engineering Garmin's undocumented workout schema into a typed spec an LLM can drive.
Outside the terminal I'm a competitive marathoner chasing a sub-3:00 finish, and I fly small planes on weekends purely as a hobby. Both hobbies keep turning into engineering problems: the METAR streaming pipeline (Kafka → Spark Structured Streaming → Delta Lake), the live flight tracker, and the Infinite Flight tooling on this page are real-time data work that started with aviation data, and the Strava and pace tools came from running. Weather systems, astronomy, and sport pull at me for the same reason. I value time with family and friends, and I'm happiest building whatever comes next. My flight log →
Here are some of my notable projects:
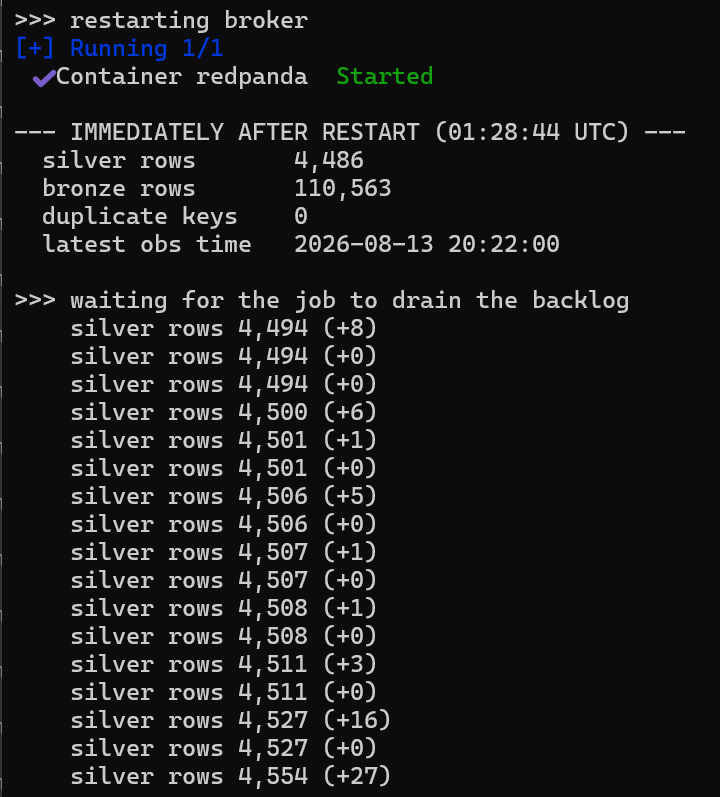
station_id produced 2,364
Parquet files for 38 MB of data; repartitioning by date cut it to 6.
Two Spark jobs sharing a checkpoint directory corrupted the offset log,
and recovery meant rebuilding downstream layers from the replayable
bronze source. A 181-second broker outage was survived with zero
duplicate keys.
left_anti with
left_semi. Published with that result documented rather than omitted,
because the binding constraint is corpus size, not architecture. Adapter and
dataset are both on HuggingFace Hub.
get_scheduled_workouts() went month-scoped and dict-returning;
two shipped tools still called it the old way and raised TypeError
against the version the project's own dependency floor allowed. The offline
suite never caught it because every test mocked the calendar away — it
surfaced on the first live run. Reading the generated output caught two more:
the gap analysis told a sub-3:30 athlete the block had to reach 20 miles twice
before the taper while the generator capped long runs at 30% of weekly volume,
which tops out at 16 miles on a 53 mi/wk peak — the plan contradicted its own
report. And down weeks were counted per phase while the mileage ramp cut on the
absolute week, so cutback weeks ran full quality and climbing weeks got the
reduced load. All three are now covered by tests that assert the plan against
what the assessment claims, rather than just that it builds.
HTTP_RESPONSE_CONTENT_TYPE_FIT. The system files it straight
into the device's course list and the app hands off to native turn-by-turn
navigation. No account linkage, no partner approval. Validated by an
independent parser and by Garmin Connect's own importer accepting the file.
mypy --strict, and CI across Linux/macOS/Windows including a smoke job that proves
the offline claim by running the whole pipeline with no model, no credentials, and no network.
Flying is a hobby. Here's my logbook, my live simulator stats, and the data engineering it gives me an excuse to build.
Aviation is a hobby, not a career track — my career is AI and data engineering. I fly part-time for fun and I'm working toward a Private Pilot certificate (personal, non-commercial flying) at my own pace. What the hobby gives my engineering is a steady supply of real-world data: the METAR streaming pipeline (Kafka → Spark Structured Streaming → Delta Lake), the live ADS-B flight tracker, and the Infinite Flight panel below (a serverless API proxy with edge caching and last-known-good fallback) all started here.
Weekend flying, logged for fun.
Live from the Infinite Flight Live API v2.
Real-time flights across the World powered by ADS-B transponder data and FlightAware. Includes airline, origin, and destination where available. Updates every 5 minutes.
A snapshot from my real-time streaming pipeline: Kafka → Spark Structured Streaming → Delta Lake, ingesting surface observations from every reporting US airport weather station. Flight categories below are the FAA standard — the same four a pilot checks before departing.
These come from the Kafka → Spark Structured Streaming → Delta Lake pipeline, which runs on demand rather than continuously. The live conditions above refresh hourly from a separate batch job.
The streaming job writes Silver; dbt owns everything after it — the transformations, the tests, and the lineage. It runs alongside the Spark Gold job rather than replacing it, which means the two can be diffed against each other. That diff is the last number below.
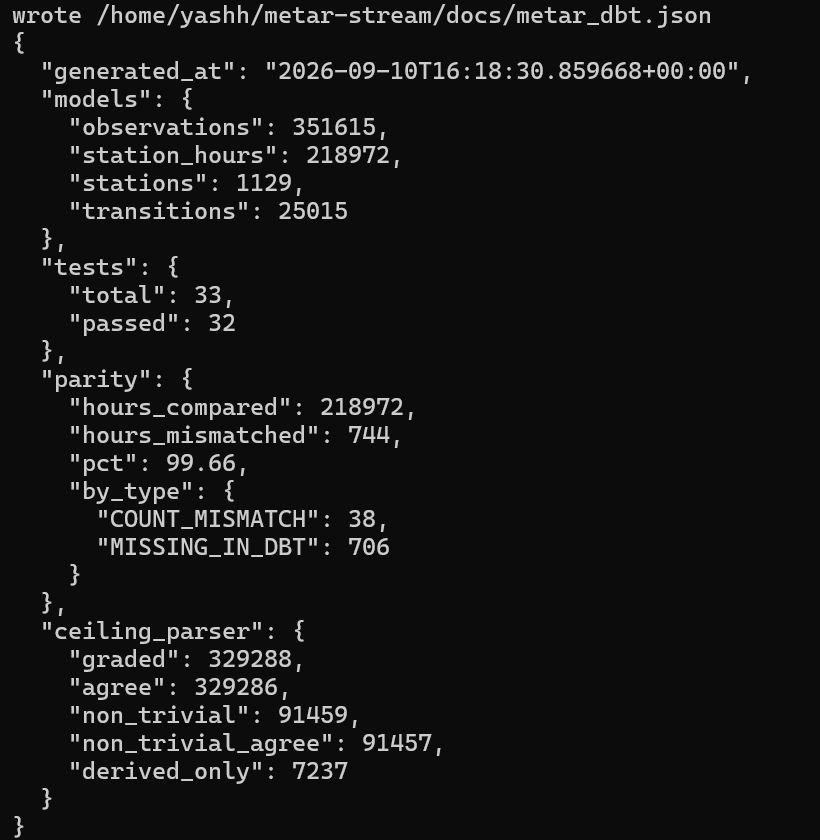
publish.sh writes one JSON after every build — model row counts, 32/33 tests, parity split into count mismatches vs. rows missing in dbt, and the ceiling parser's agreement with NOAA.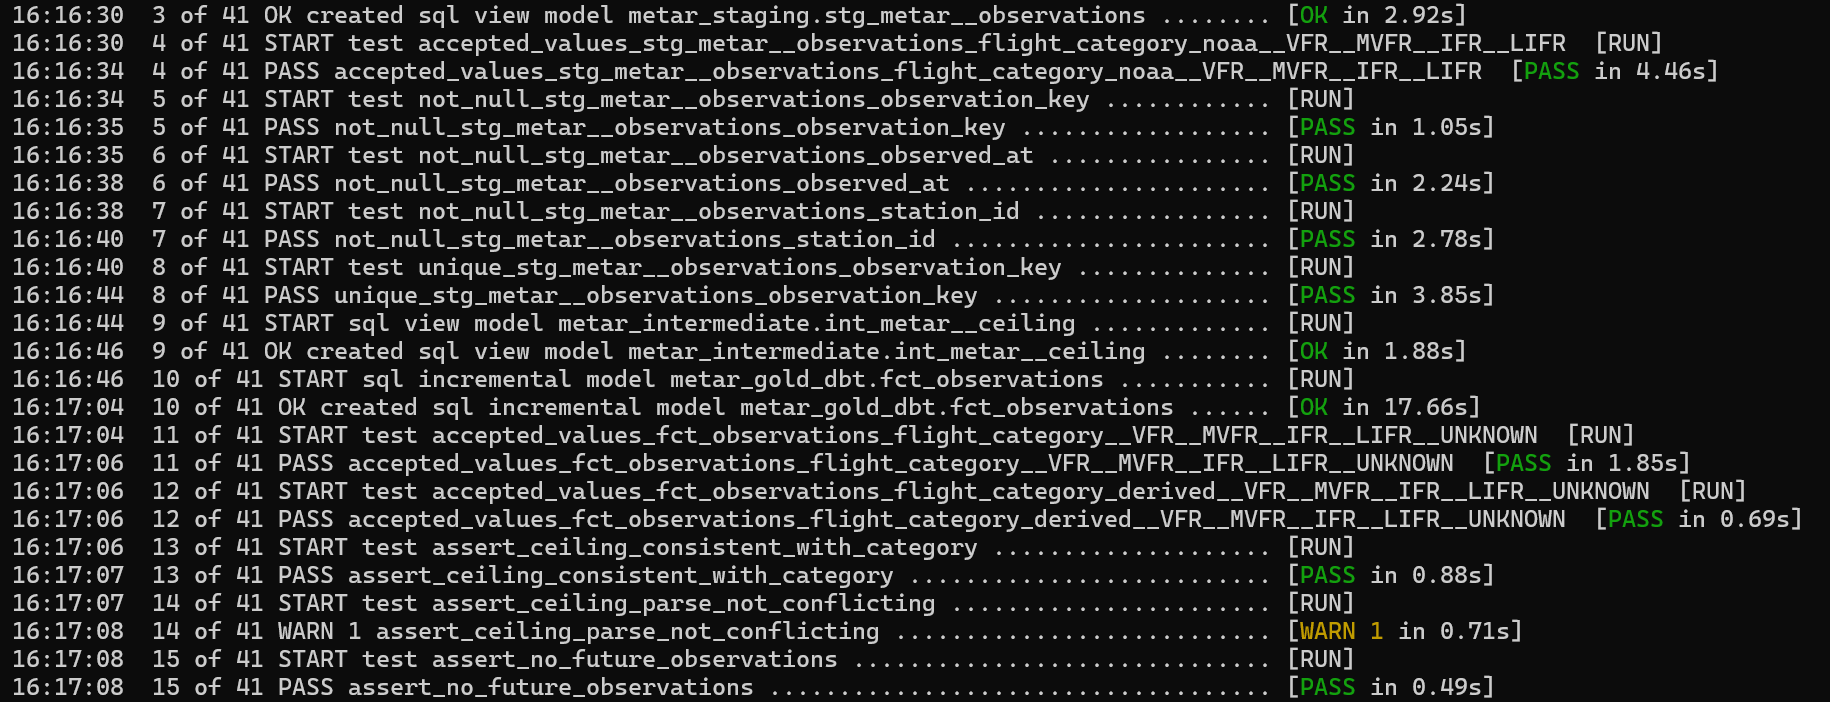
WARN 1 is assert_ceiling_parse_not_conflicting — the two NOAA disagreements described above, kept visible rather than silenced.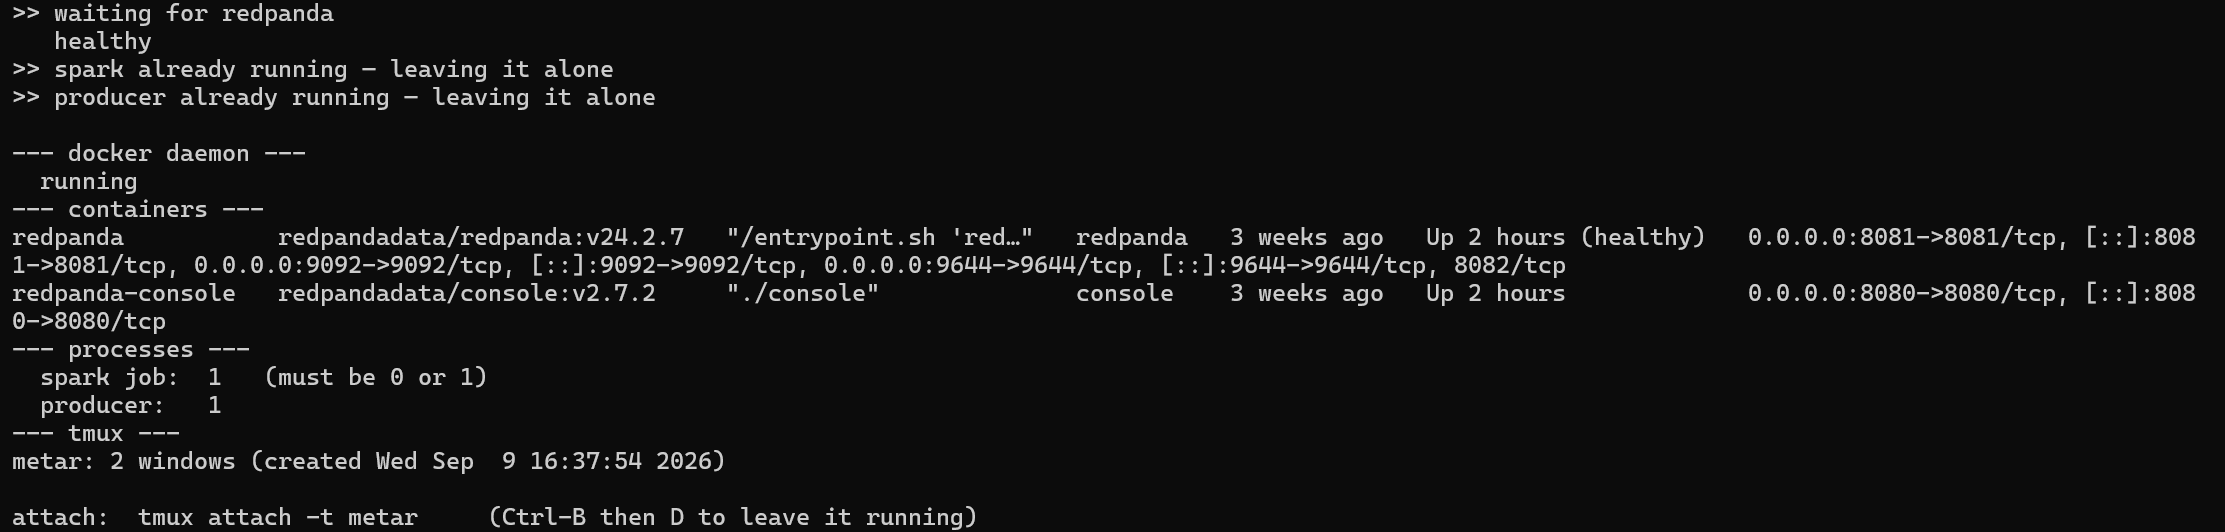
start.sh. Brings up Redpanda, waits for healthy, and leaves an already-running Spark job and producer alone — the process guard enforces exactly one of each.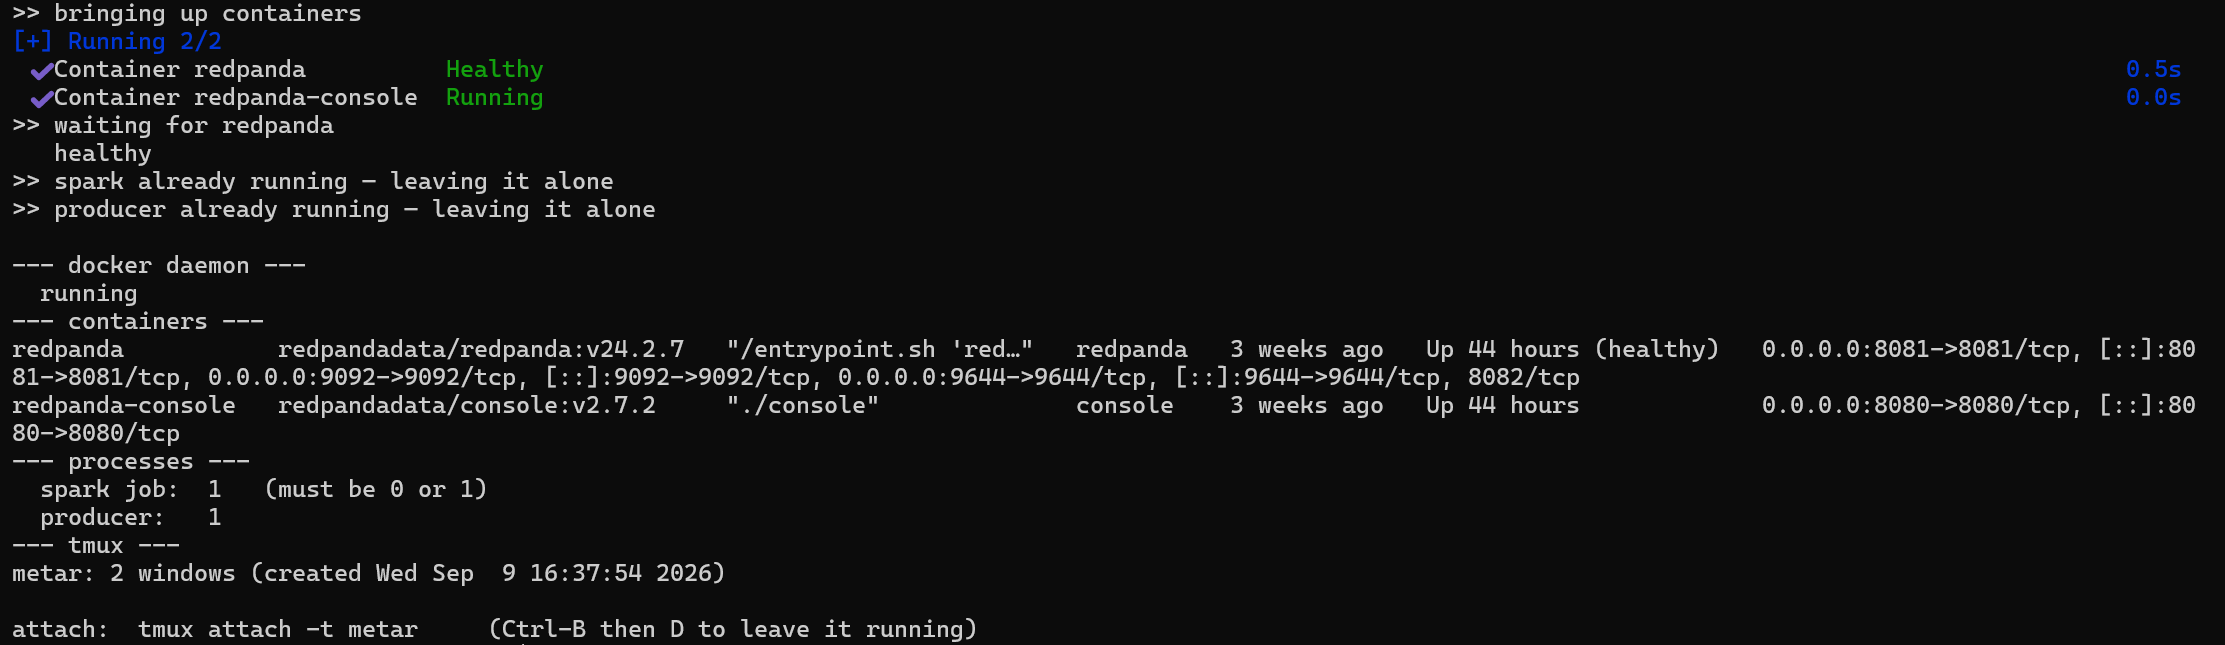
Live weather for wherever you're accessing this site from.
57 years (1970–2026) of NOAA daily station data · 13 cities · Bronze → Silver → Gold pipeline
Loading signal...
Loading signal...
Loading signal...
Loading signal...
Atlantic hurricane activity vs. the sea-surface temperature storms intensify over · HURDAT2 · NOAA TNA · GISTEMP
Loading signal...
Loading signal...
Loading signal...
Reading this honestly: these coefficients show association, not attribution. Year-to-year Atlantic activity is strongly steered by ENSO and the Atlantic Multidecadal Oscillation. A positive correlation is consistent with the physics — warmer water carries more energy — but isolating the human-caused share requires counterfactual potential-intensity modeling, not a scatter plot.
Satellite sea-level rise, U.S. coastal risk hot-spots, and how far seas would climb if the ice sheets melted
Loading signal...
Loading signal...
Loading signal...
Loading signal...
Reading this honestly: the ice-melt bars show each reservoir's ultimate ceiling — how far seas would climb over centuries to millennia if it fully melted — not a 2100 forecast. This century's projected rise is roughly 0.3–1 m (up to ~2 m for the U.S. coast on high-emission, rapid-ice-loss pathways). Local rates differ from the global average mainly because of land subsidence, which is why the Gulf Coast tops the map.
How fast data-center power demand is growing, where the U.S. clusters are, and what it costs in water and energy
Loading signal...
Loading signal...
Loading signal...
Loading signal...
Reading this honestly: per-query water and energy numbers are genuinely contested and span orders of magnitude, so they're shown as ranges. At the individual level an AI prompt is tiny next to everyday items — a single burger is ~1,650 L of water. What actually strains systems is the aggregate and its geographic concentration: a handful of clusters (Northern Virginia alone ≈ a quarter of the state's electricity) pull enormous, localized loads on grids and watersheds — and efficiency gains keep being outrun by sheer growth.
Running has been my passion and a source of discipline and motivation. I've competed in various distances and continue to push my limits. Notable achievements include:
Follow my training journey on my public Strava account: here.
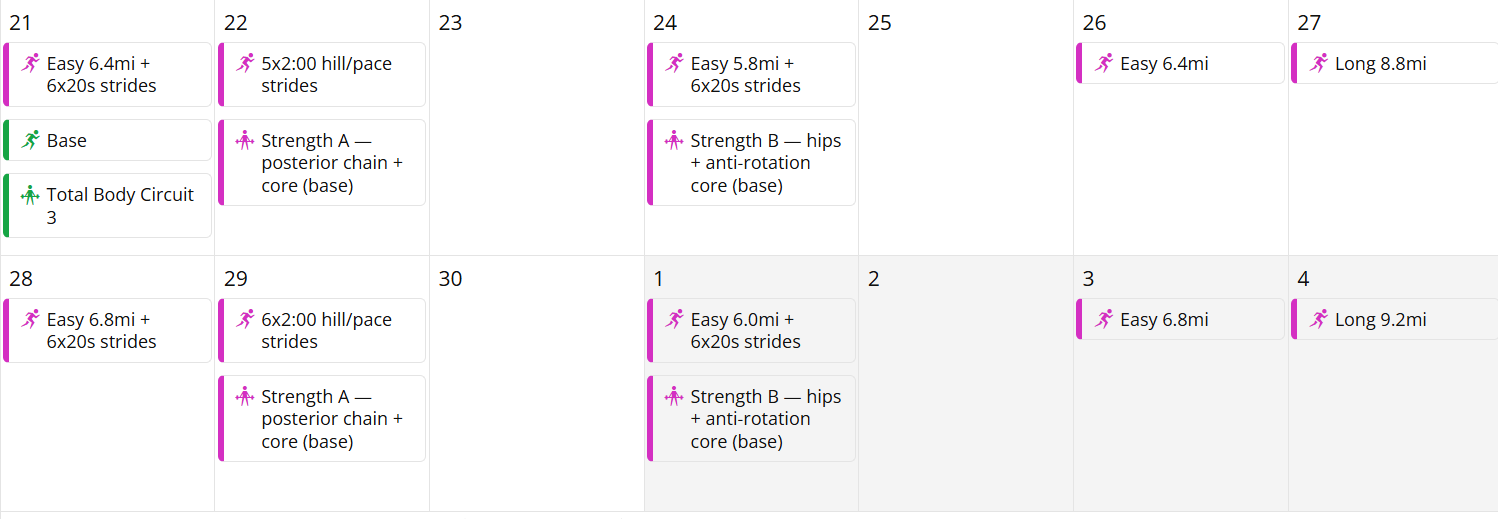
mcp-garmin reads my logged Garmin history, works out the gap between current fitness and a goal race, and writes a whole training block — runs, strength, fuelling notes — straight to the Garmin calendar. The block below is real output: a sub-3:00 Chevron Houston Marathon build, generated from 34 mi/wk of logged running and a 1:25 half marathon.
| Wk | Phase | Miles | Long | Strength |
|---|
3-up-1-down cycles ramping 8%/week from current mileage, down weeks in amber, long runs reaching 20 twice before a three-week taper. Strength lands on quality days so easy days stay easy and nothing sits the day before a long run.
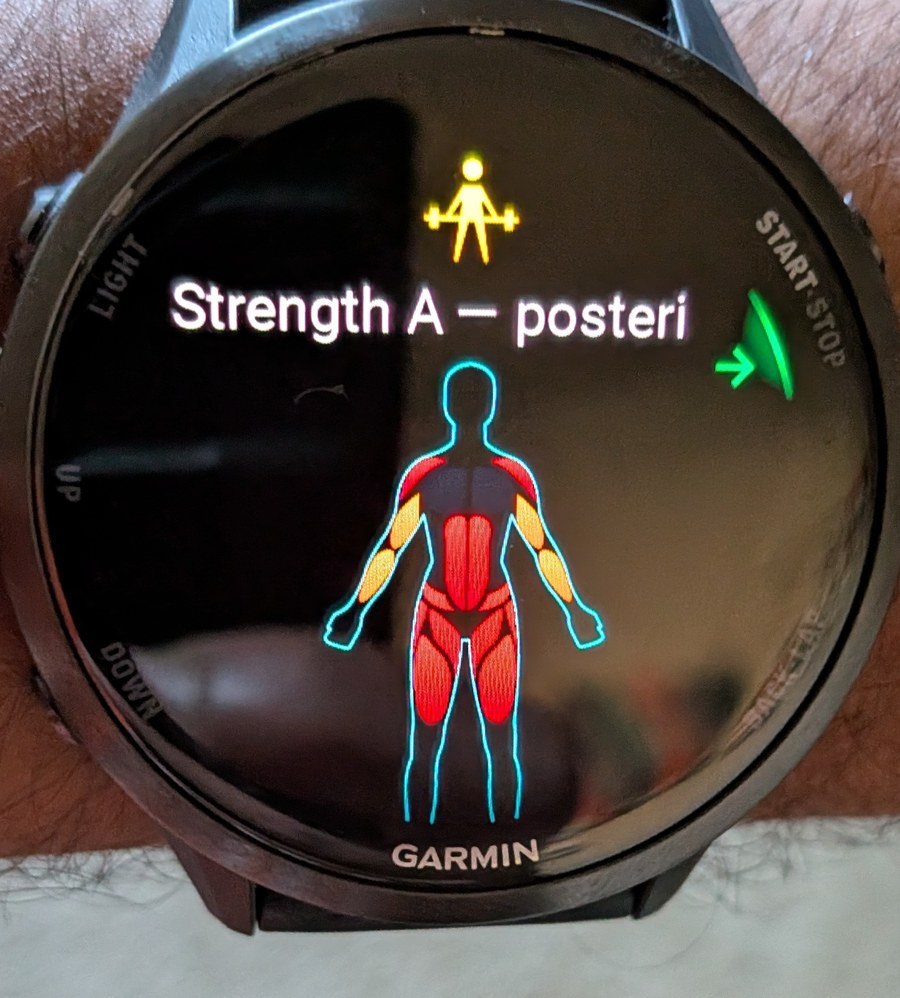
Two strength sessions a week on quality days — posterior chain and anti-extension core on day A, hip control and anti-rotation on day B, dumbbells and a band. Down and race weeks swap the heavy day for a mobility reset so the habit survives when the load shouldn't. Each workout description carries its own fuelling and recovery line, so the guidance is on the watch rather than in a document nobody opens, and each week returns a nutrition, hydration and recovery brief alongside the schedule. The same engine builds high-school track blocks for the sub-2:00 800, sub-4:30 1600, sub-10:00 3200 and sub-15:00 5K, with weekly mileage ceilings set by training age and a full rest day every week.
Tool · Running × Weather
Air temperature and dew point decide how much of your sweat can actually evaporate. Add them together and you get the number that predicts how much slower the same effort will feel today.
CONDITIONS — · SUM — · ZONE —
Or enter conditions by hand.
Conditions
Your run
—
Zone
| Scenario | Temp / dew | Pace | Finish |
|---|
Model: the temperature + dew point sum, interpolated across the standard heat-pace bands, then scaled by effort — easy running responds least because effort, not pace, is the target — and by how long you’ll be out there, since heat compounds with time on your feet. Heat tolerance is individual and improves with acclimation; treat this as a starting point, not a prescription. Live conditions from NOAA/Aviation Weather METAR.
Tool · Running × Weather
Cold air barely slows you down — 32° to 50°F is where you race your best. Wind is the part that costs real time, and it costs it as the square of the wind speed. This works out both: what the wind takes, and what the chill means for how you dress.
CONDITIONS — · CHILL — · ZONE —
Or enter conditions by hand.
Conditions
Your run
—
Zone
What to wear
| Scenario | Temp / chill | Pace | Finish |
|---|
Model: drag rises with the square of the air speed flowing over you, so the extra cost per mile scales with 2·v·w + w², where v is your running speed and w the wind. Calibrated so a 10 mph headwind costs about 11 s/mi at 7:00 pace, matching Pugh's 1971 wind-tunnel work and Davies 1980. Two consequences fall straight out of the physics rather than being bolted on: a tailwind returns only a fraction of what the headwind took, so an out-and-back always loses net time; and a crosswind costs the same as that net out-and-back. Cold itself is scored separately and stays near zero above freezing, because 32–50°F is the performance optimum — below that the cost comes from footing, clothing weight and cold airways, not from thermoregulation. Wind chill uses the NWS formula, valid at or below 50°F with wind above 3 mph. Live conditions from NOAA/Aviation Weather METAR.
Tool · Pace
Give it any two of pace, time, and distance and it solves the third — then shows what that pace is worth at every race distance.
Time
Distance
Pace
—
Straight arithmetic — no fatigue curve. Holding 5K pace for a marathon is a math result, not a prediction. For that, use the heat predictor below or a Riegel-style equivalence.
Tool · Running × Weather
Enter a result and the conditions you ran it in. This strips the heat penalty out to find the cool-air performance underneath, then re-applies it for any other temperature and dew point.
What you ran
Use the conditions at the start, not the average.
Conditions to predict
—
Zone
| Temp \ dew | 40° | 50° | 60° | 65° | 70° | 75° |
|---|
Swipe the table sideways →
Same temperature + dew point model as the pace tool, with one addition: a duration factor, because heat compounds with time on your feet. A 5K loses less to a hot day than a marathon does. Individual heat tolerance and acclimation move these numbers, so treat a prediction as a range, not a promise.
Yash's most recent completed training week — refreshed every Monday, and fed to the site's AI agent
updated —Loading…
Loading…
Running from Strava, commits from GitHub, distilled by a weekly GitHub Actions pipeline. The same summary is injected into this site's AI chat so it always knows what Yash is currently working on.
Professional certifications that reflect my skills in data engineering, AI, and data science.
Validates my knowledge of data engineering concepts, ETL pipelines, Delta Lake, and building scalable data solutions on Databricks.
View Credential →Covers Microsoft Power Platform environment, business value of Power Platform, Capabilities of Power Apps, Power Automate, and Power Pages.
View Credential →Covers machine learning, deep learning, neural networks, and practical AI model development.
View Credential →Covers Prompt Engineering, ChatGPT, trustworthy Generative AI, and ChatGPT Advanced Data Analysis.
View Credential →Demonstrates skills in Python, SQL, data analysis, visualization, machine learning, and applied data science workflows.
View Credential →I built a custom AI assistant called TARS using OpenAI's GPT-4. TARS is designed to solve real-world problems through natural conversations. Try it out below!
First solo hike in Arapaho National Forest. Soundtrack: Hans Zimmer – First Step & Day One (Interstellar).
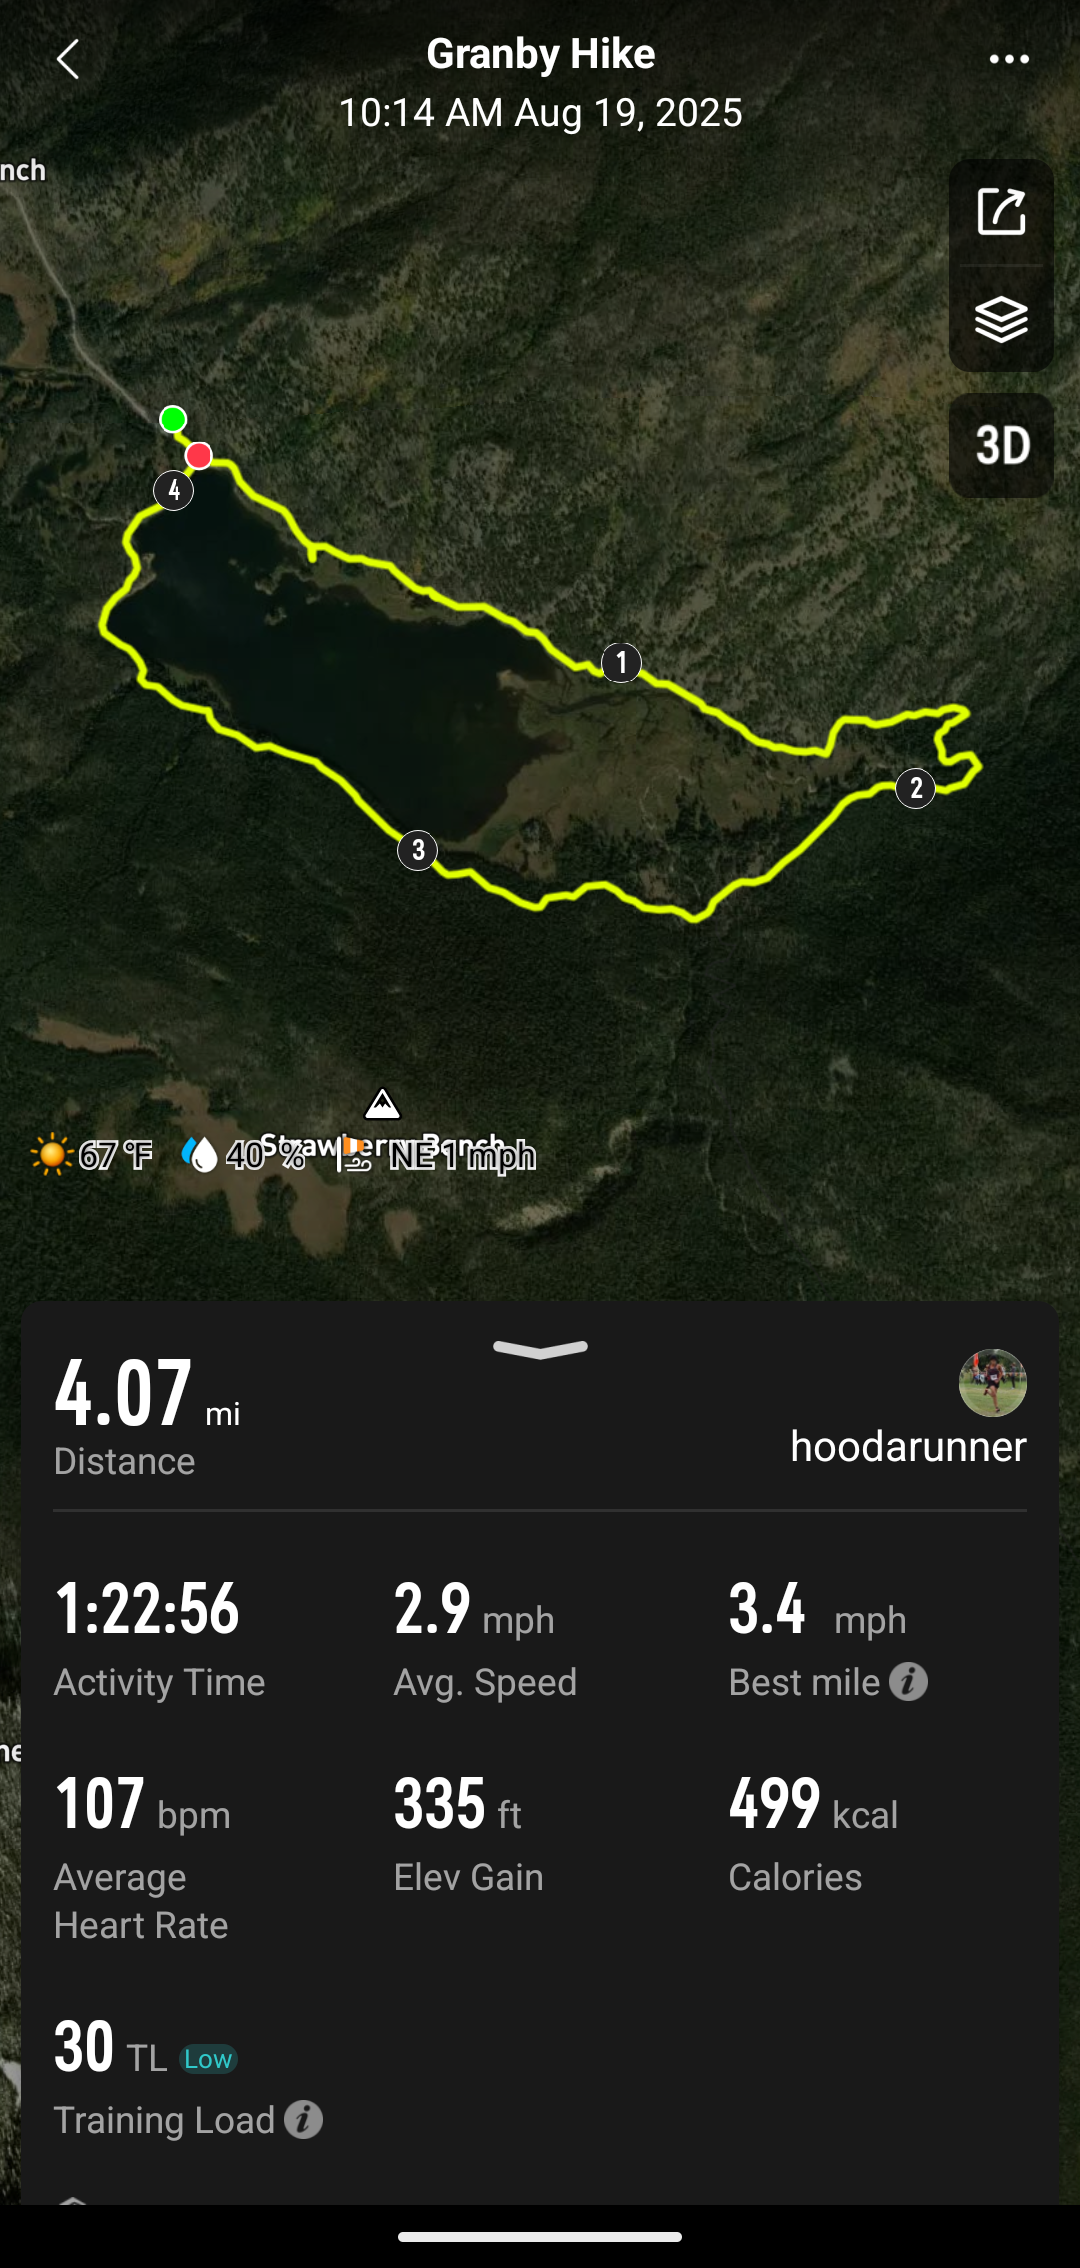
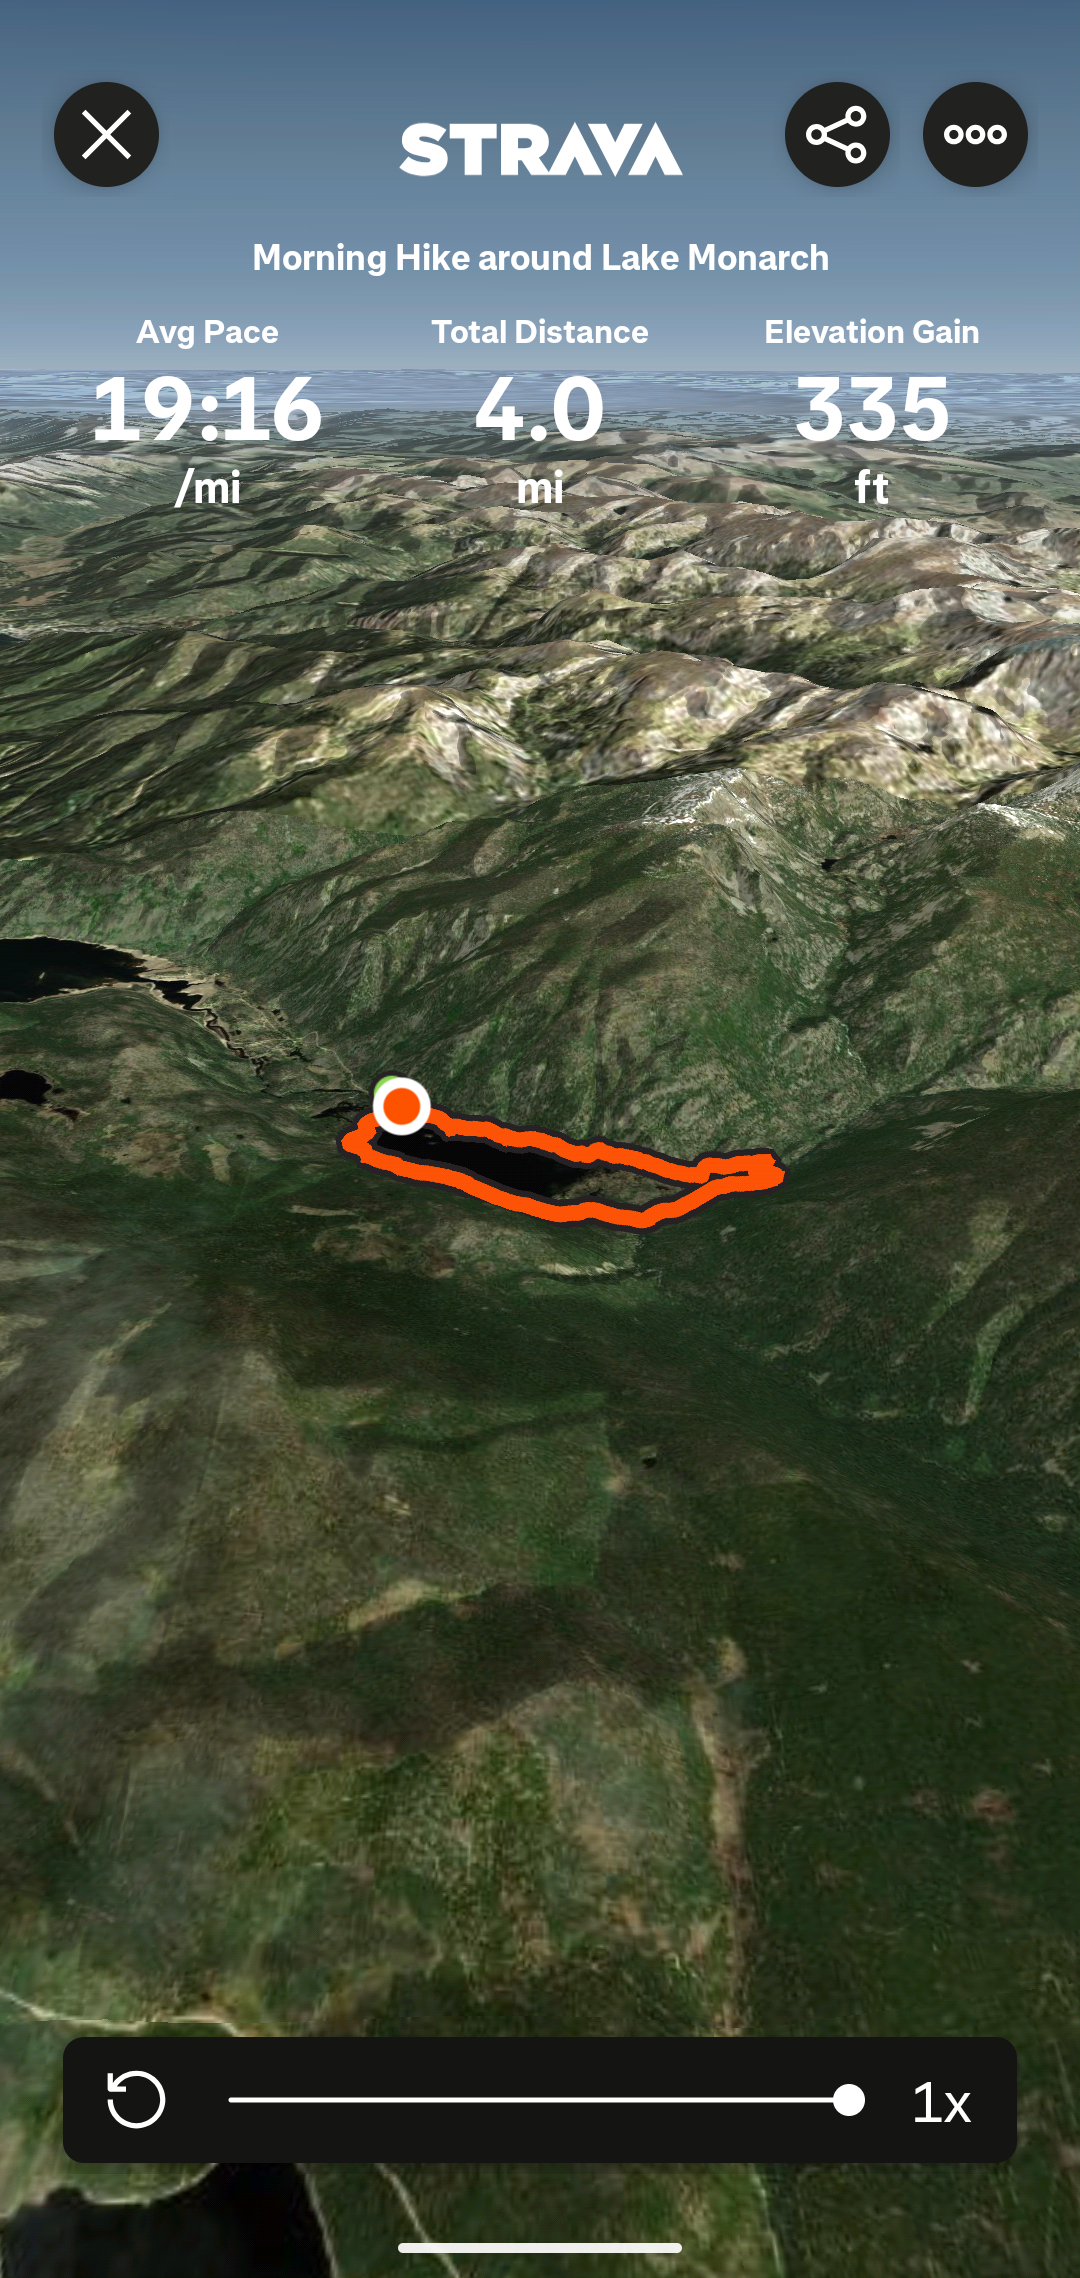
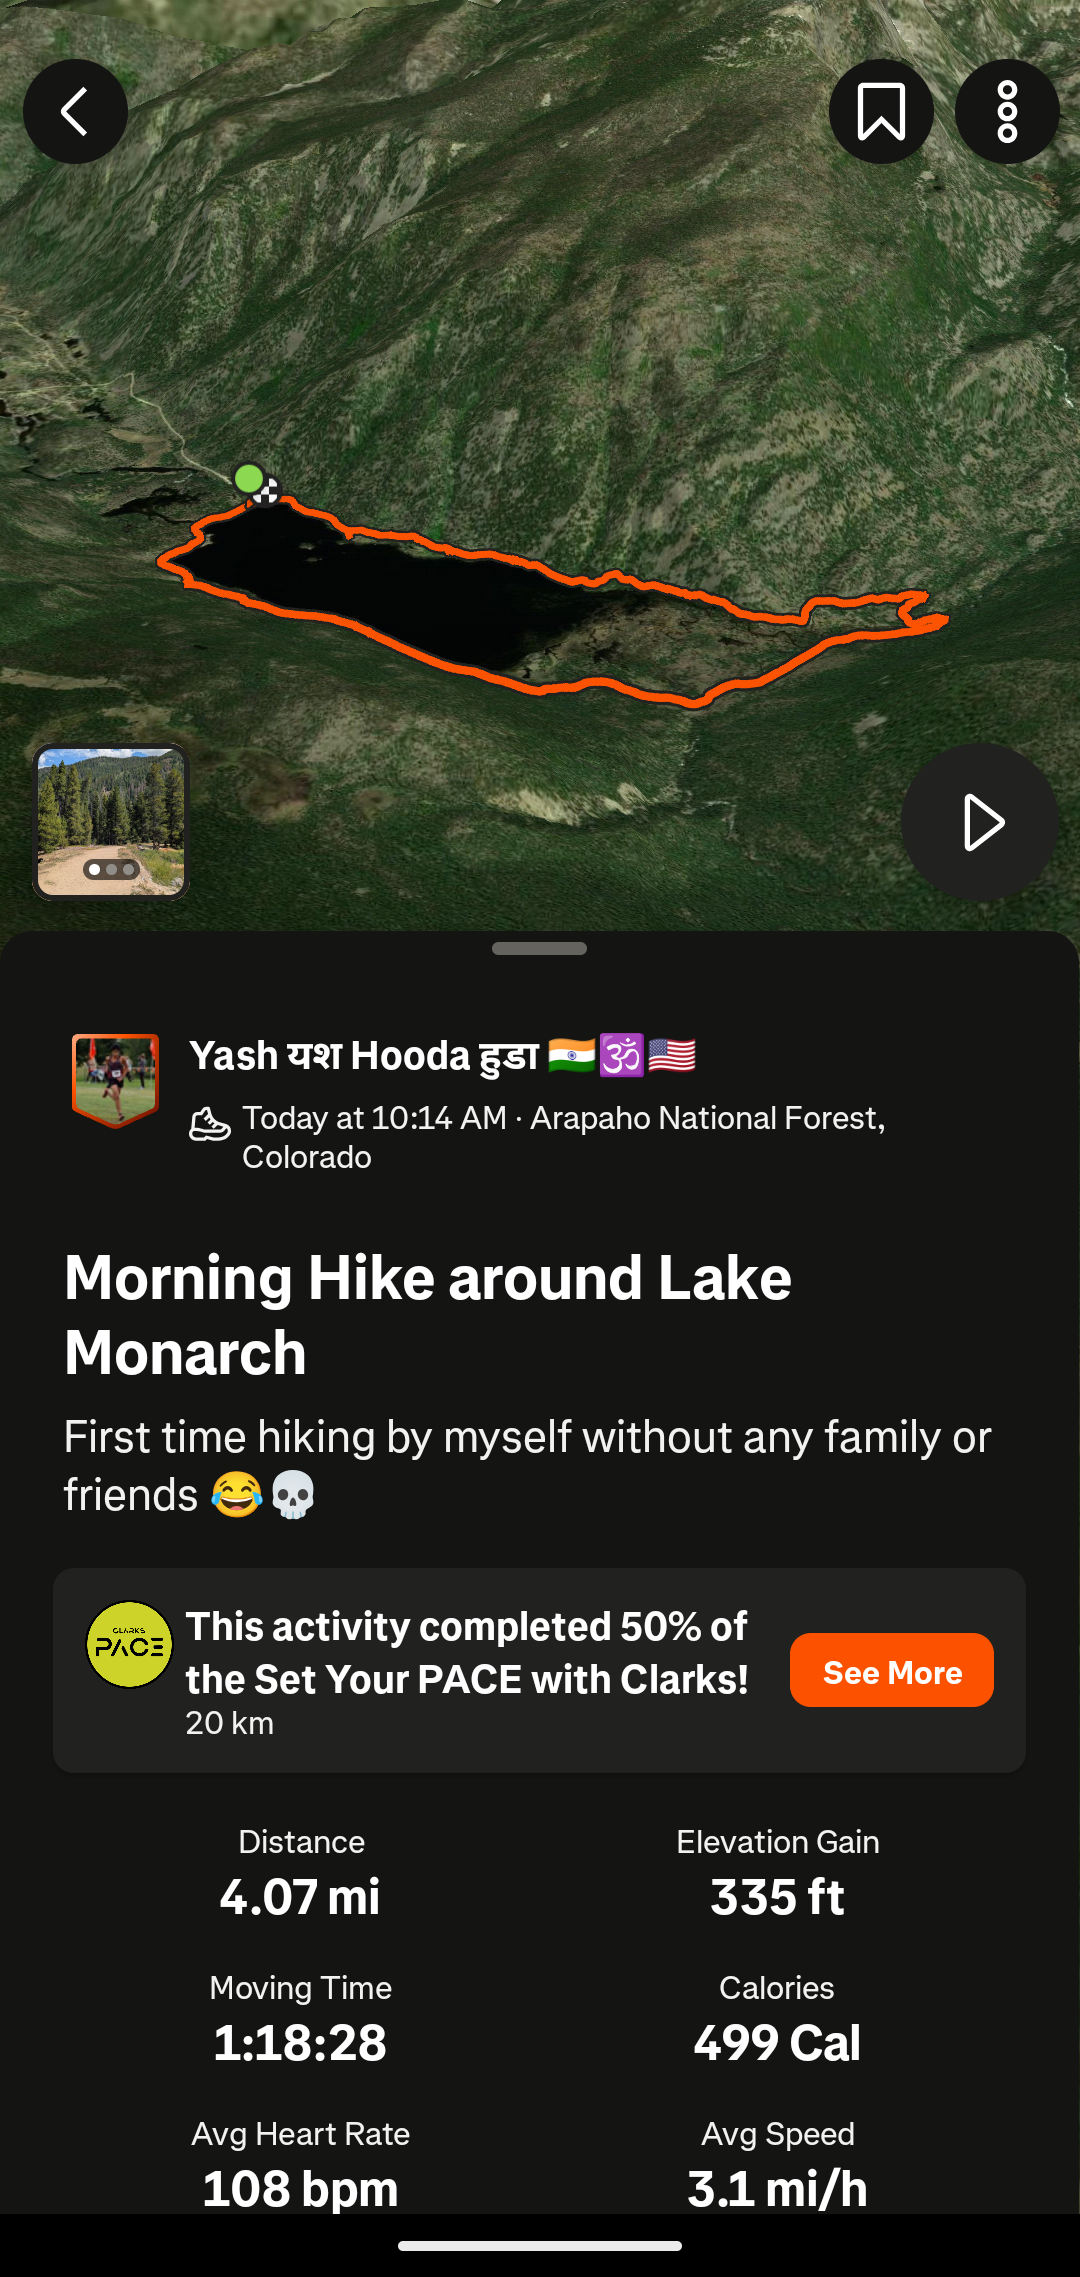
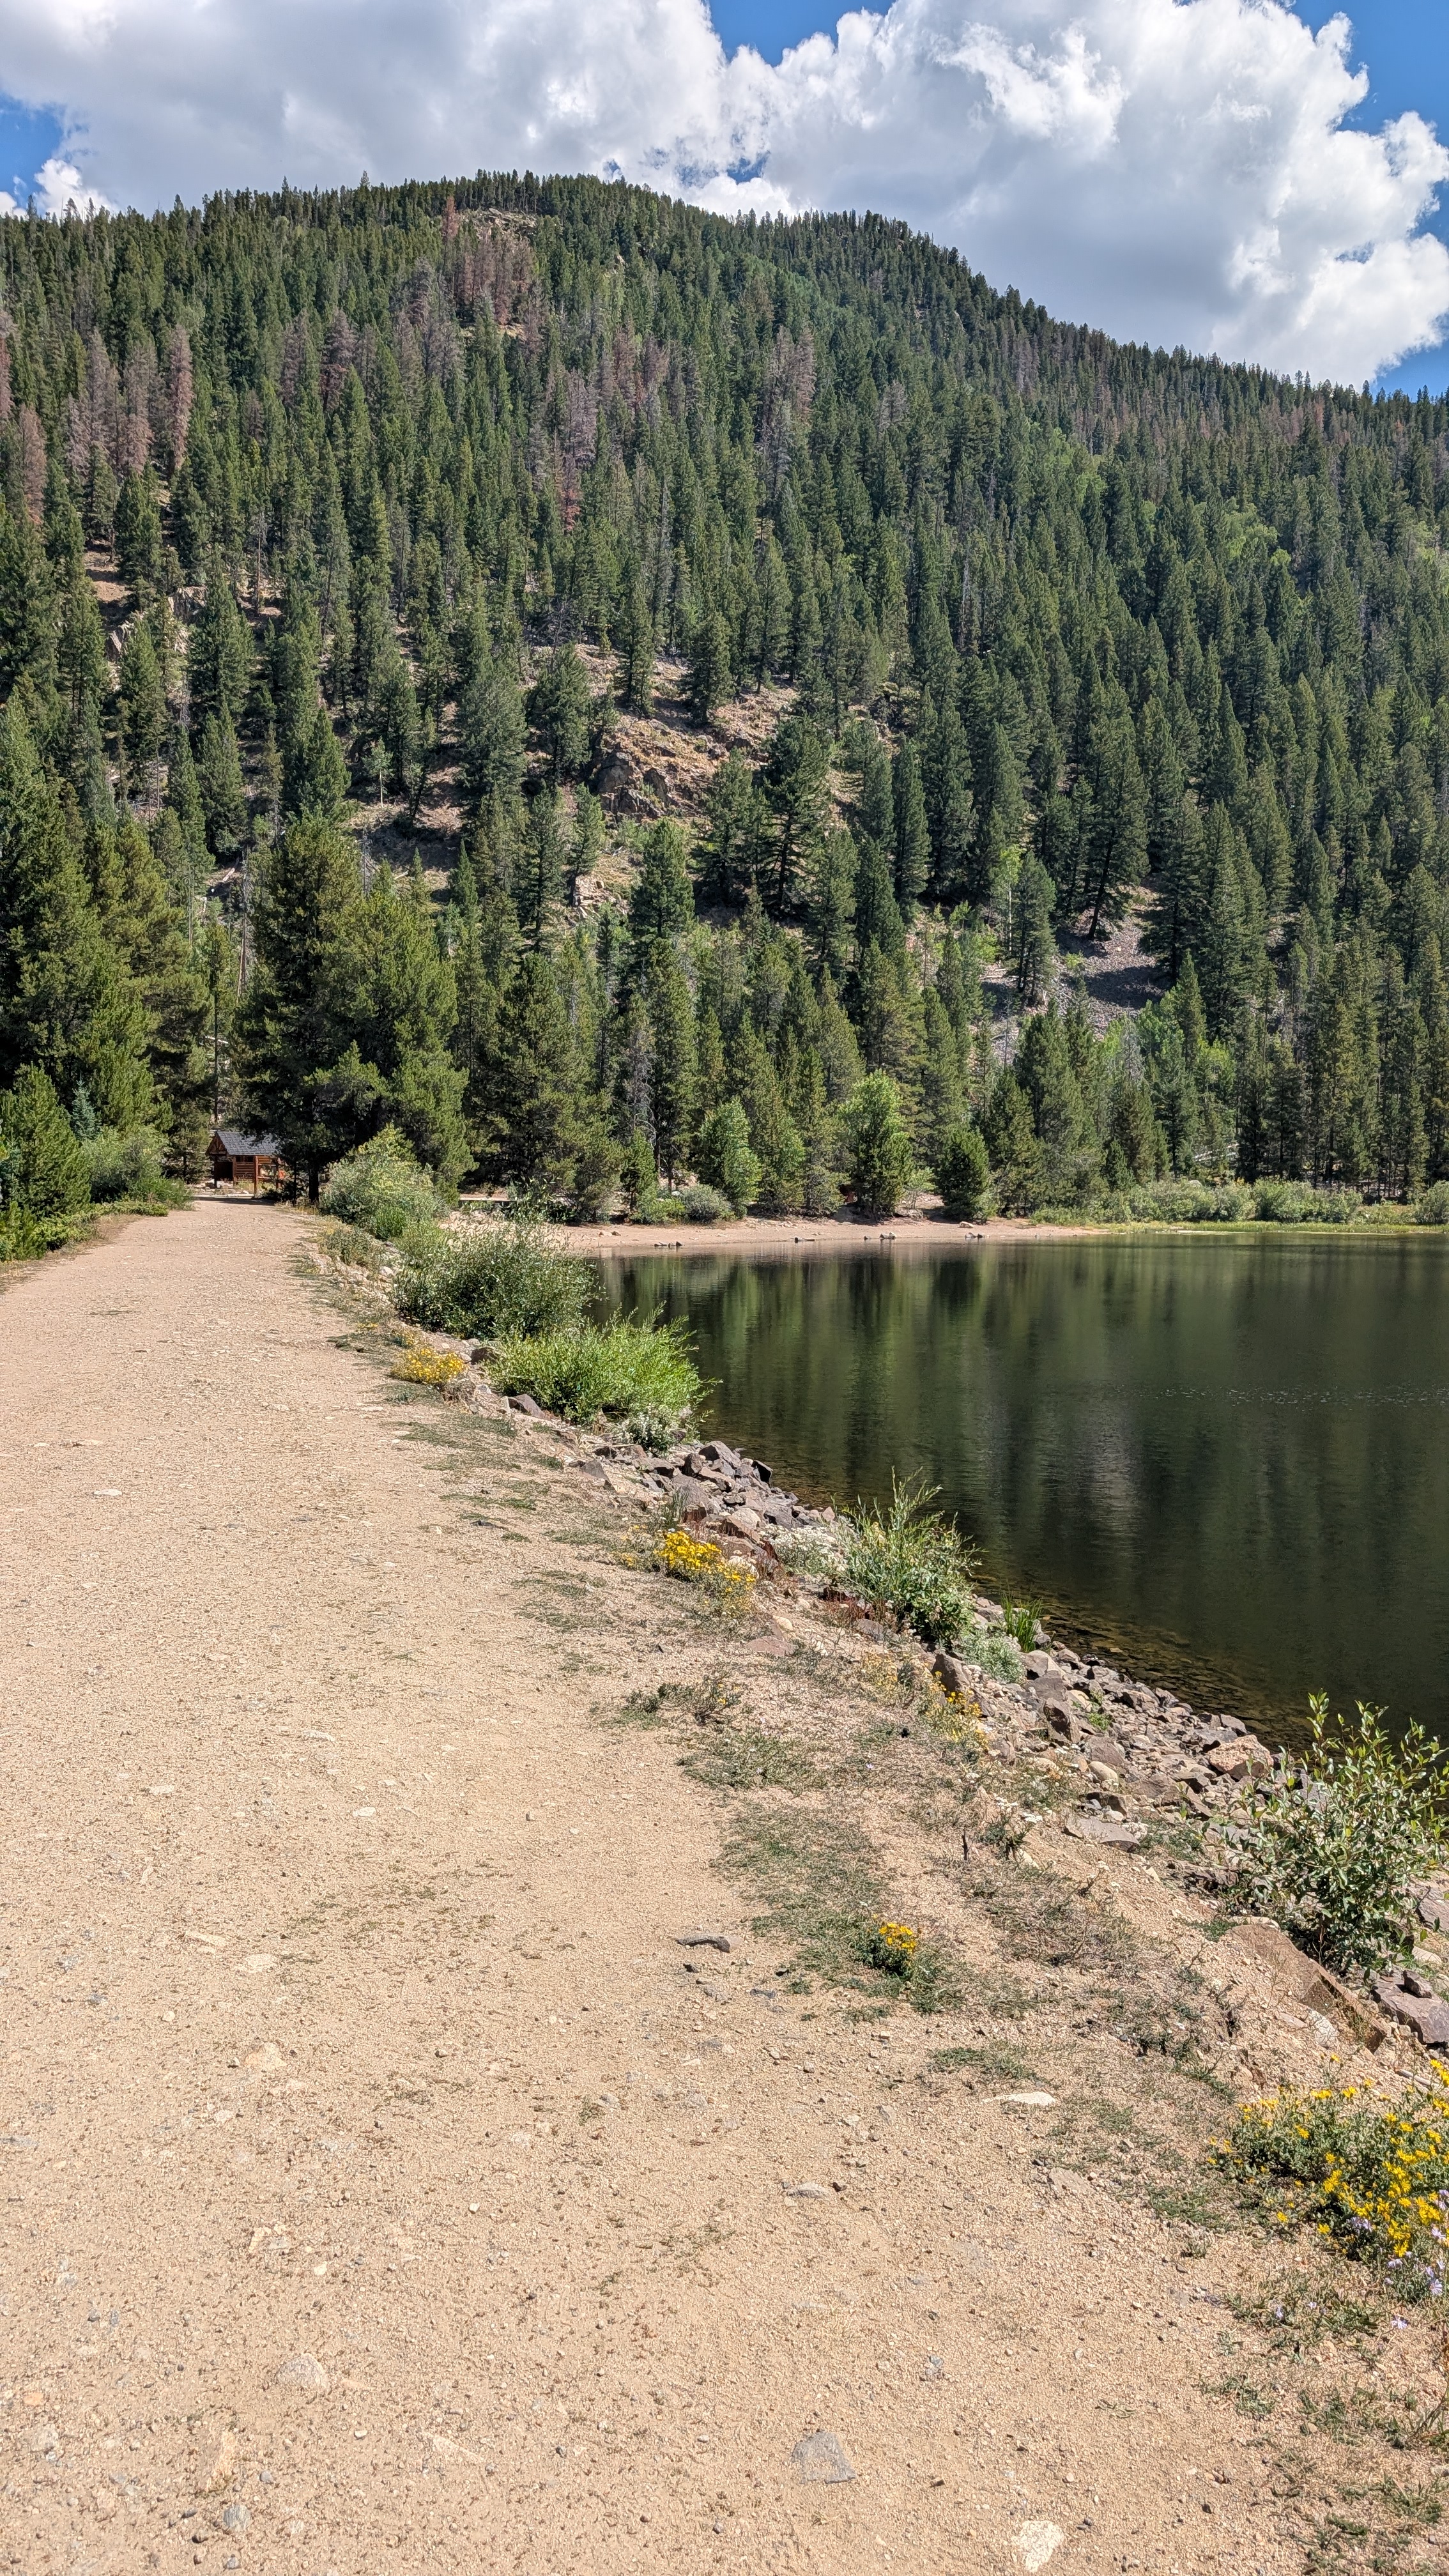
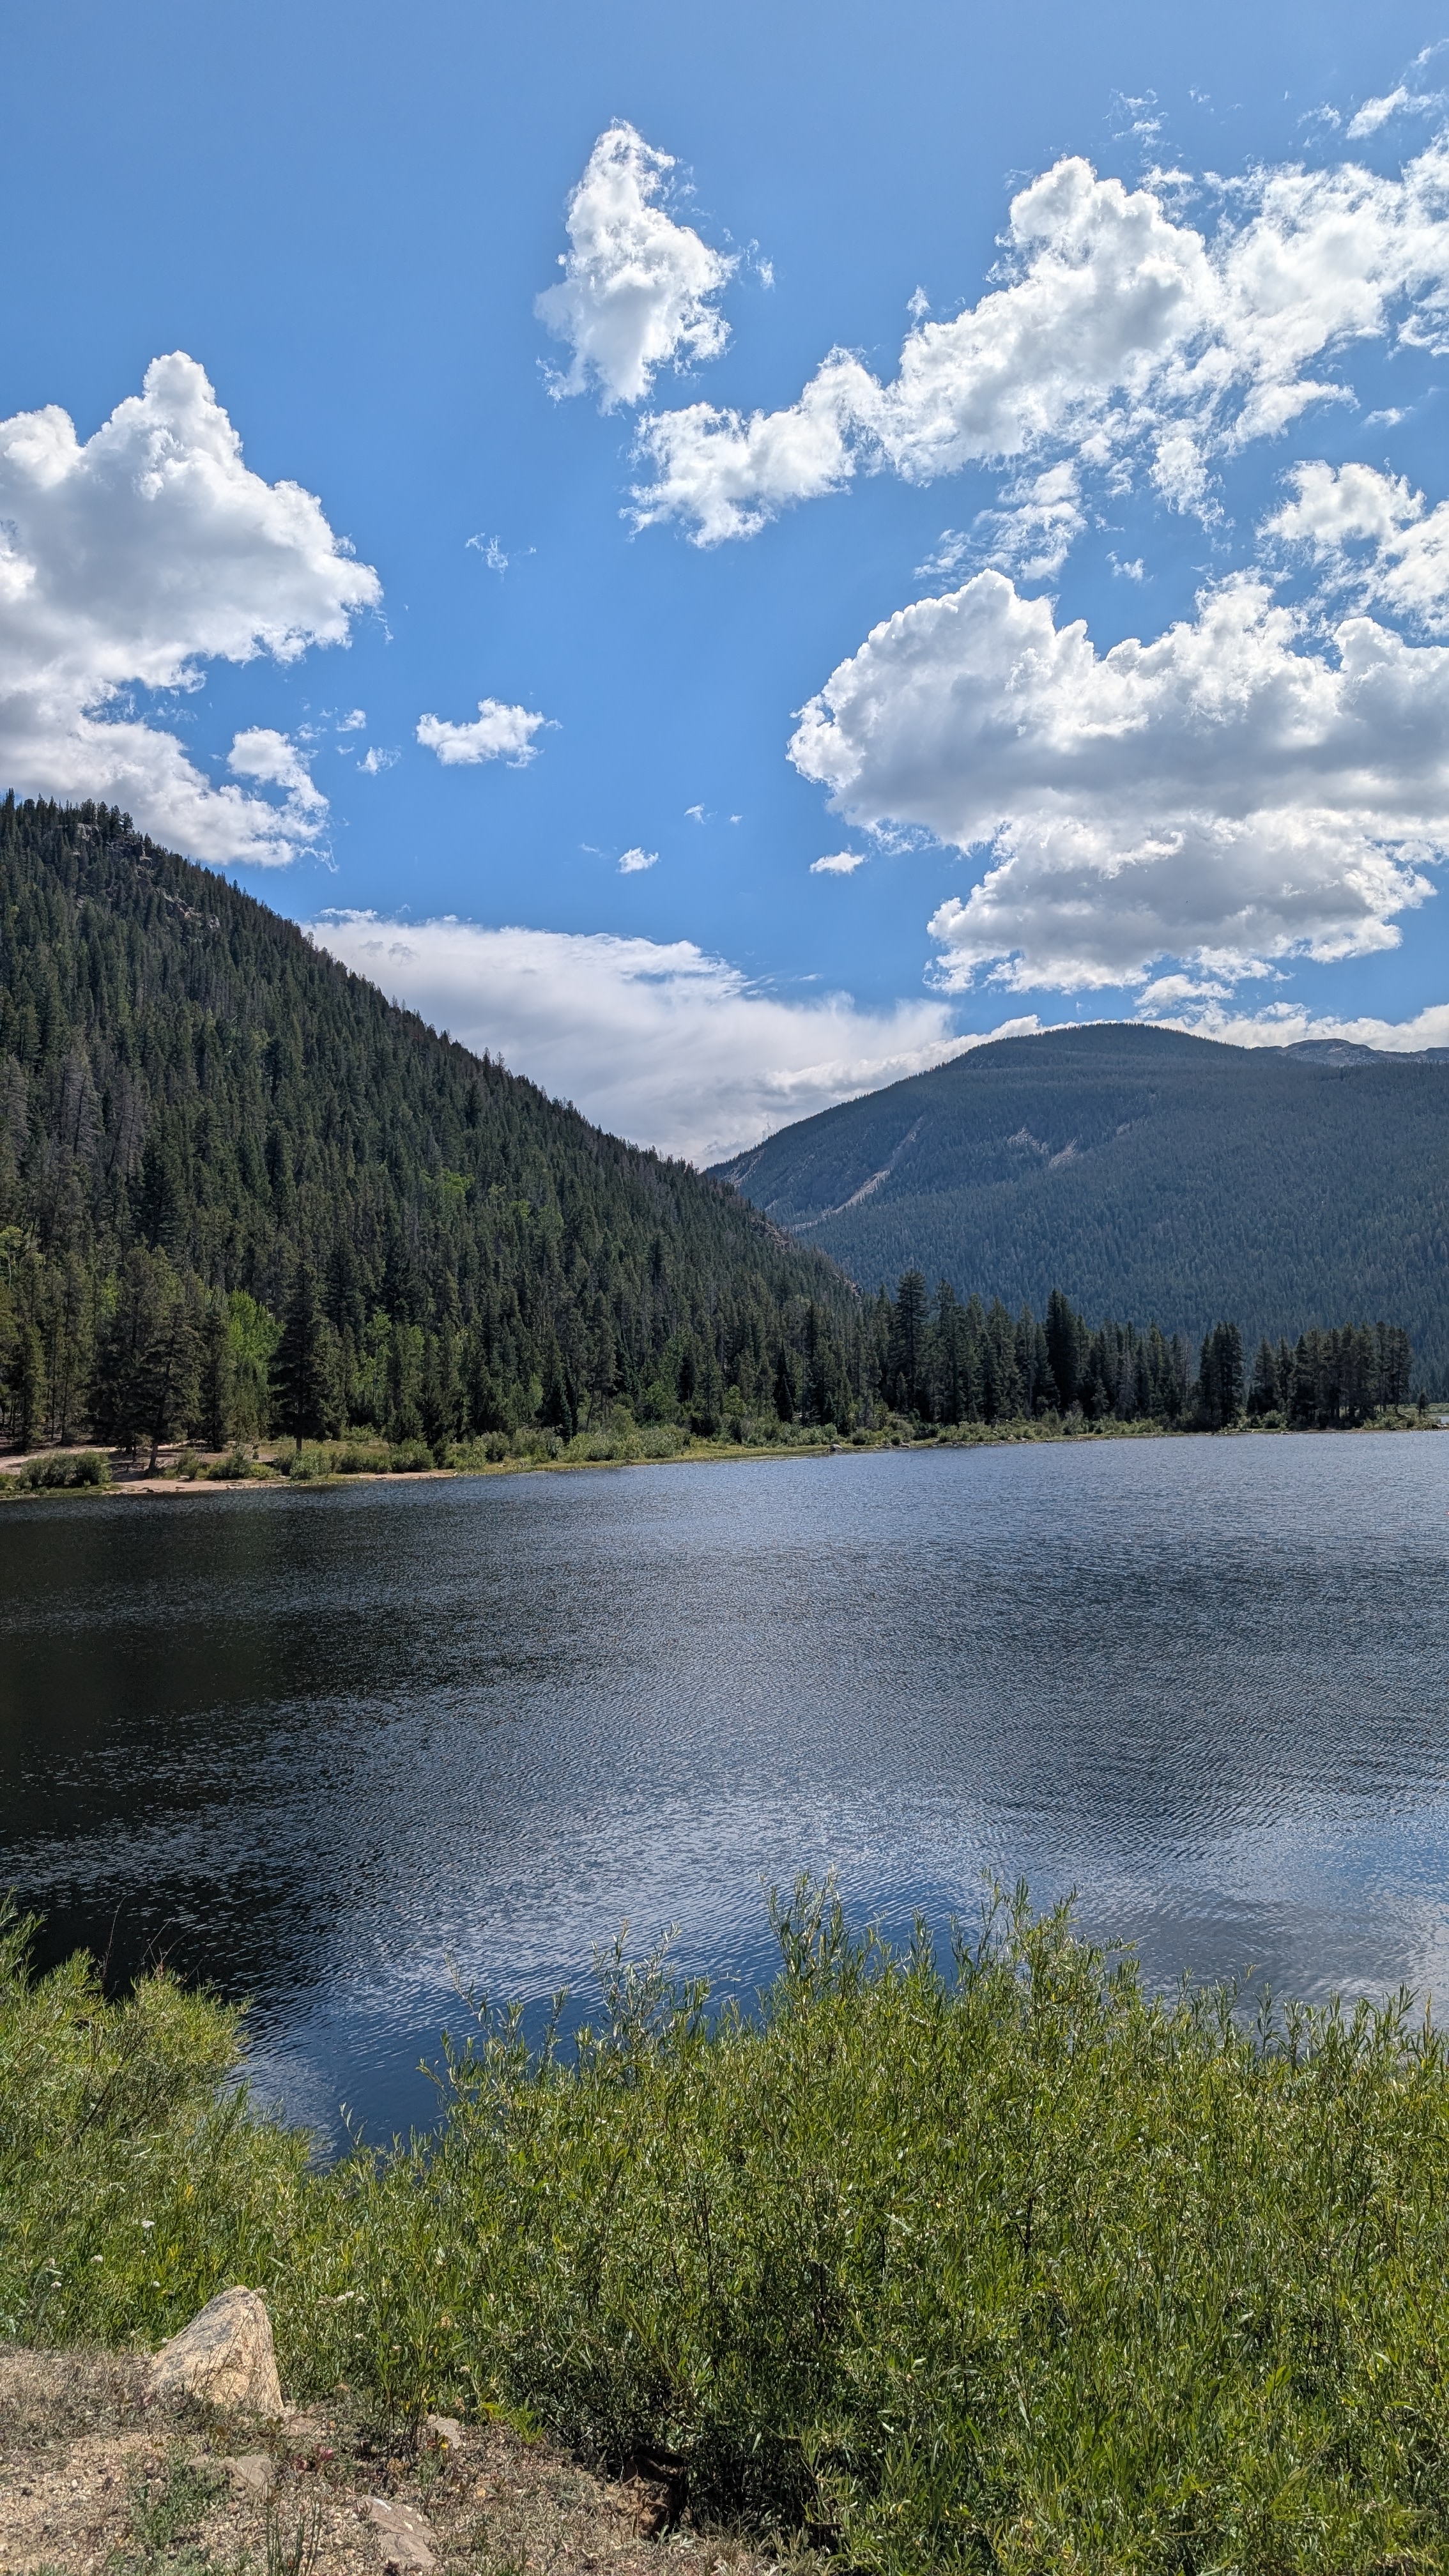
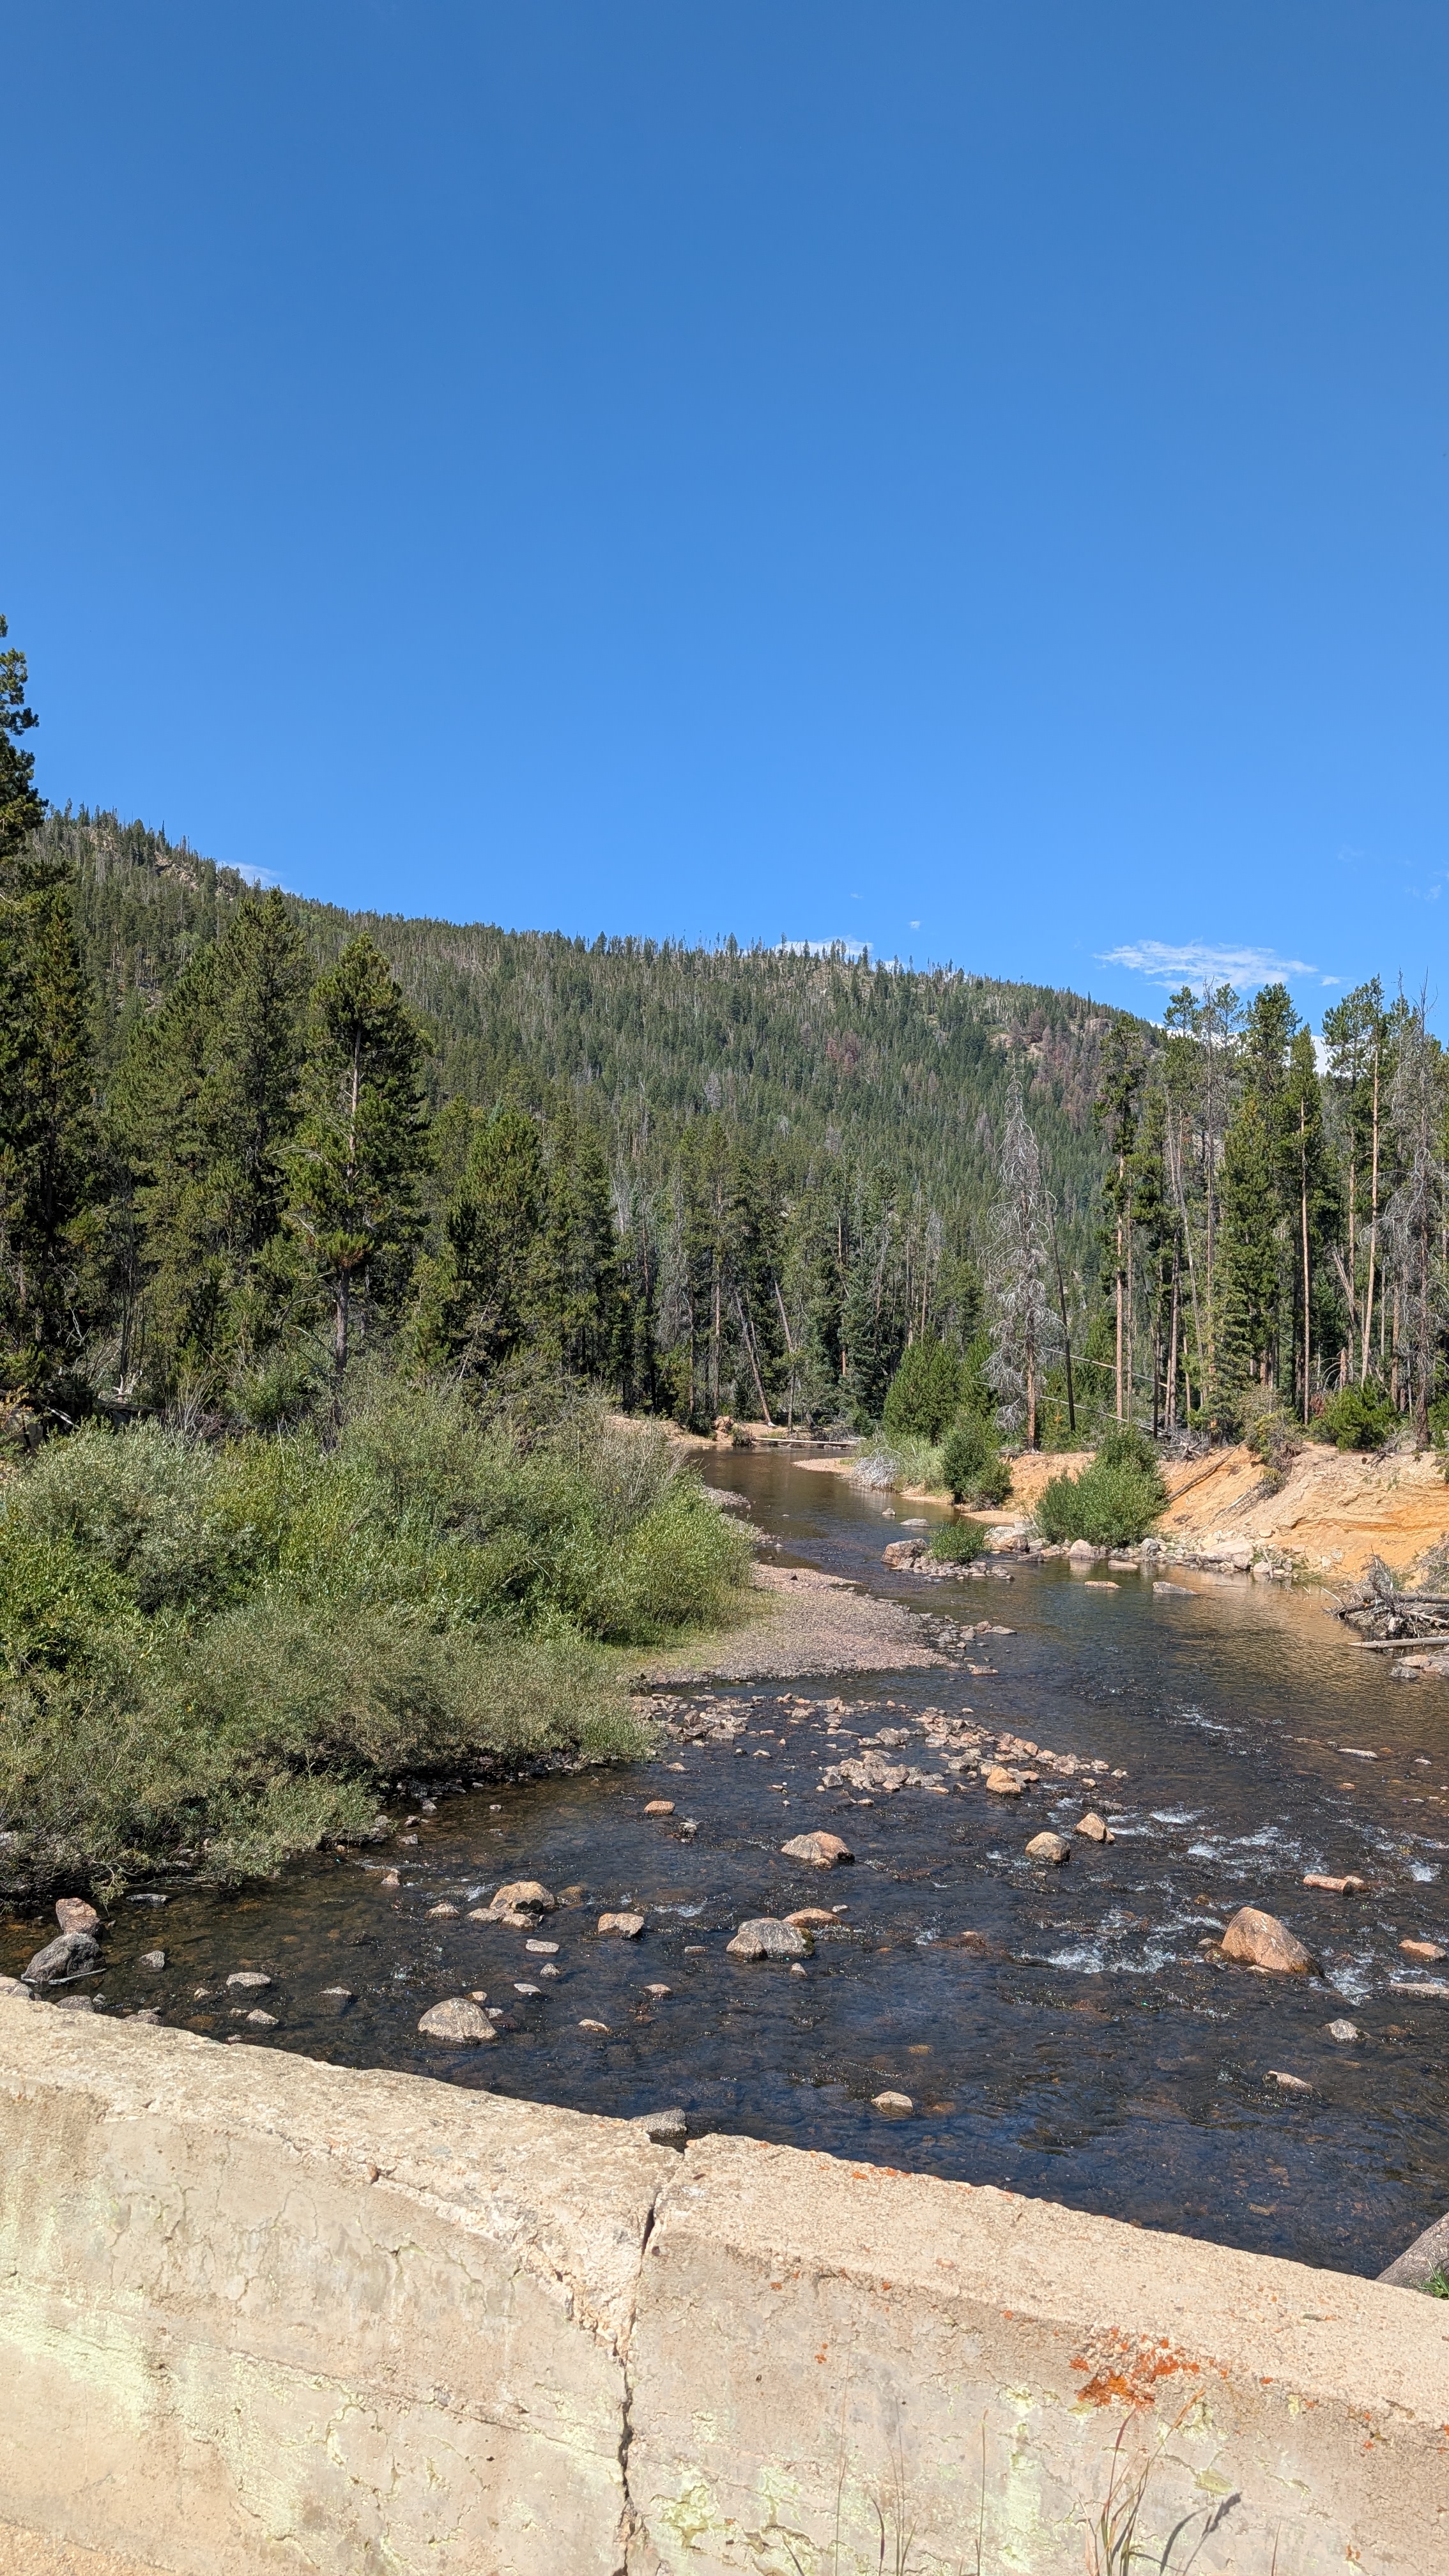
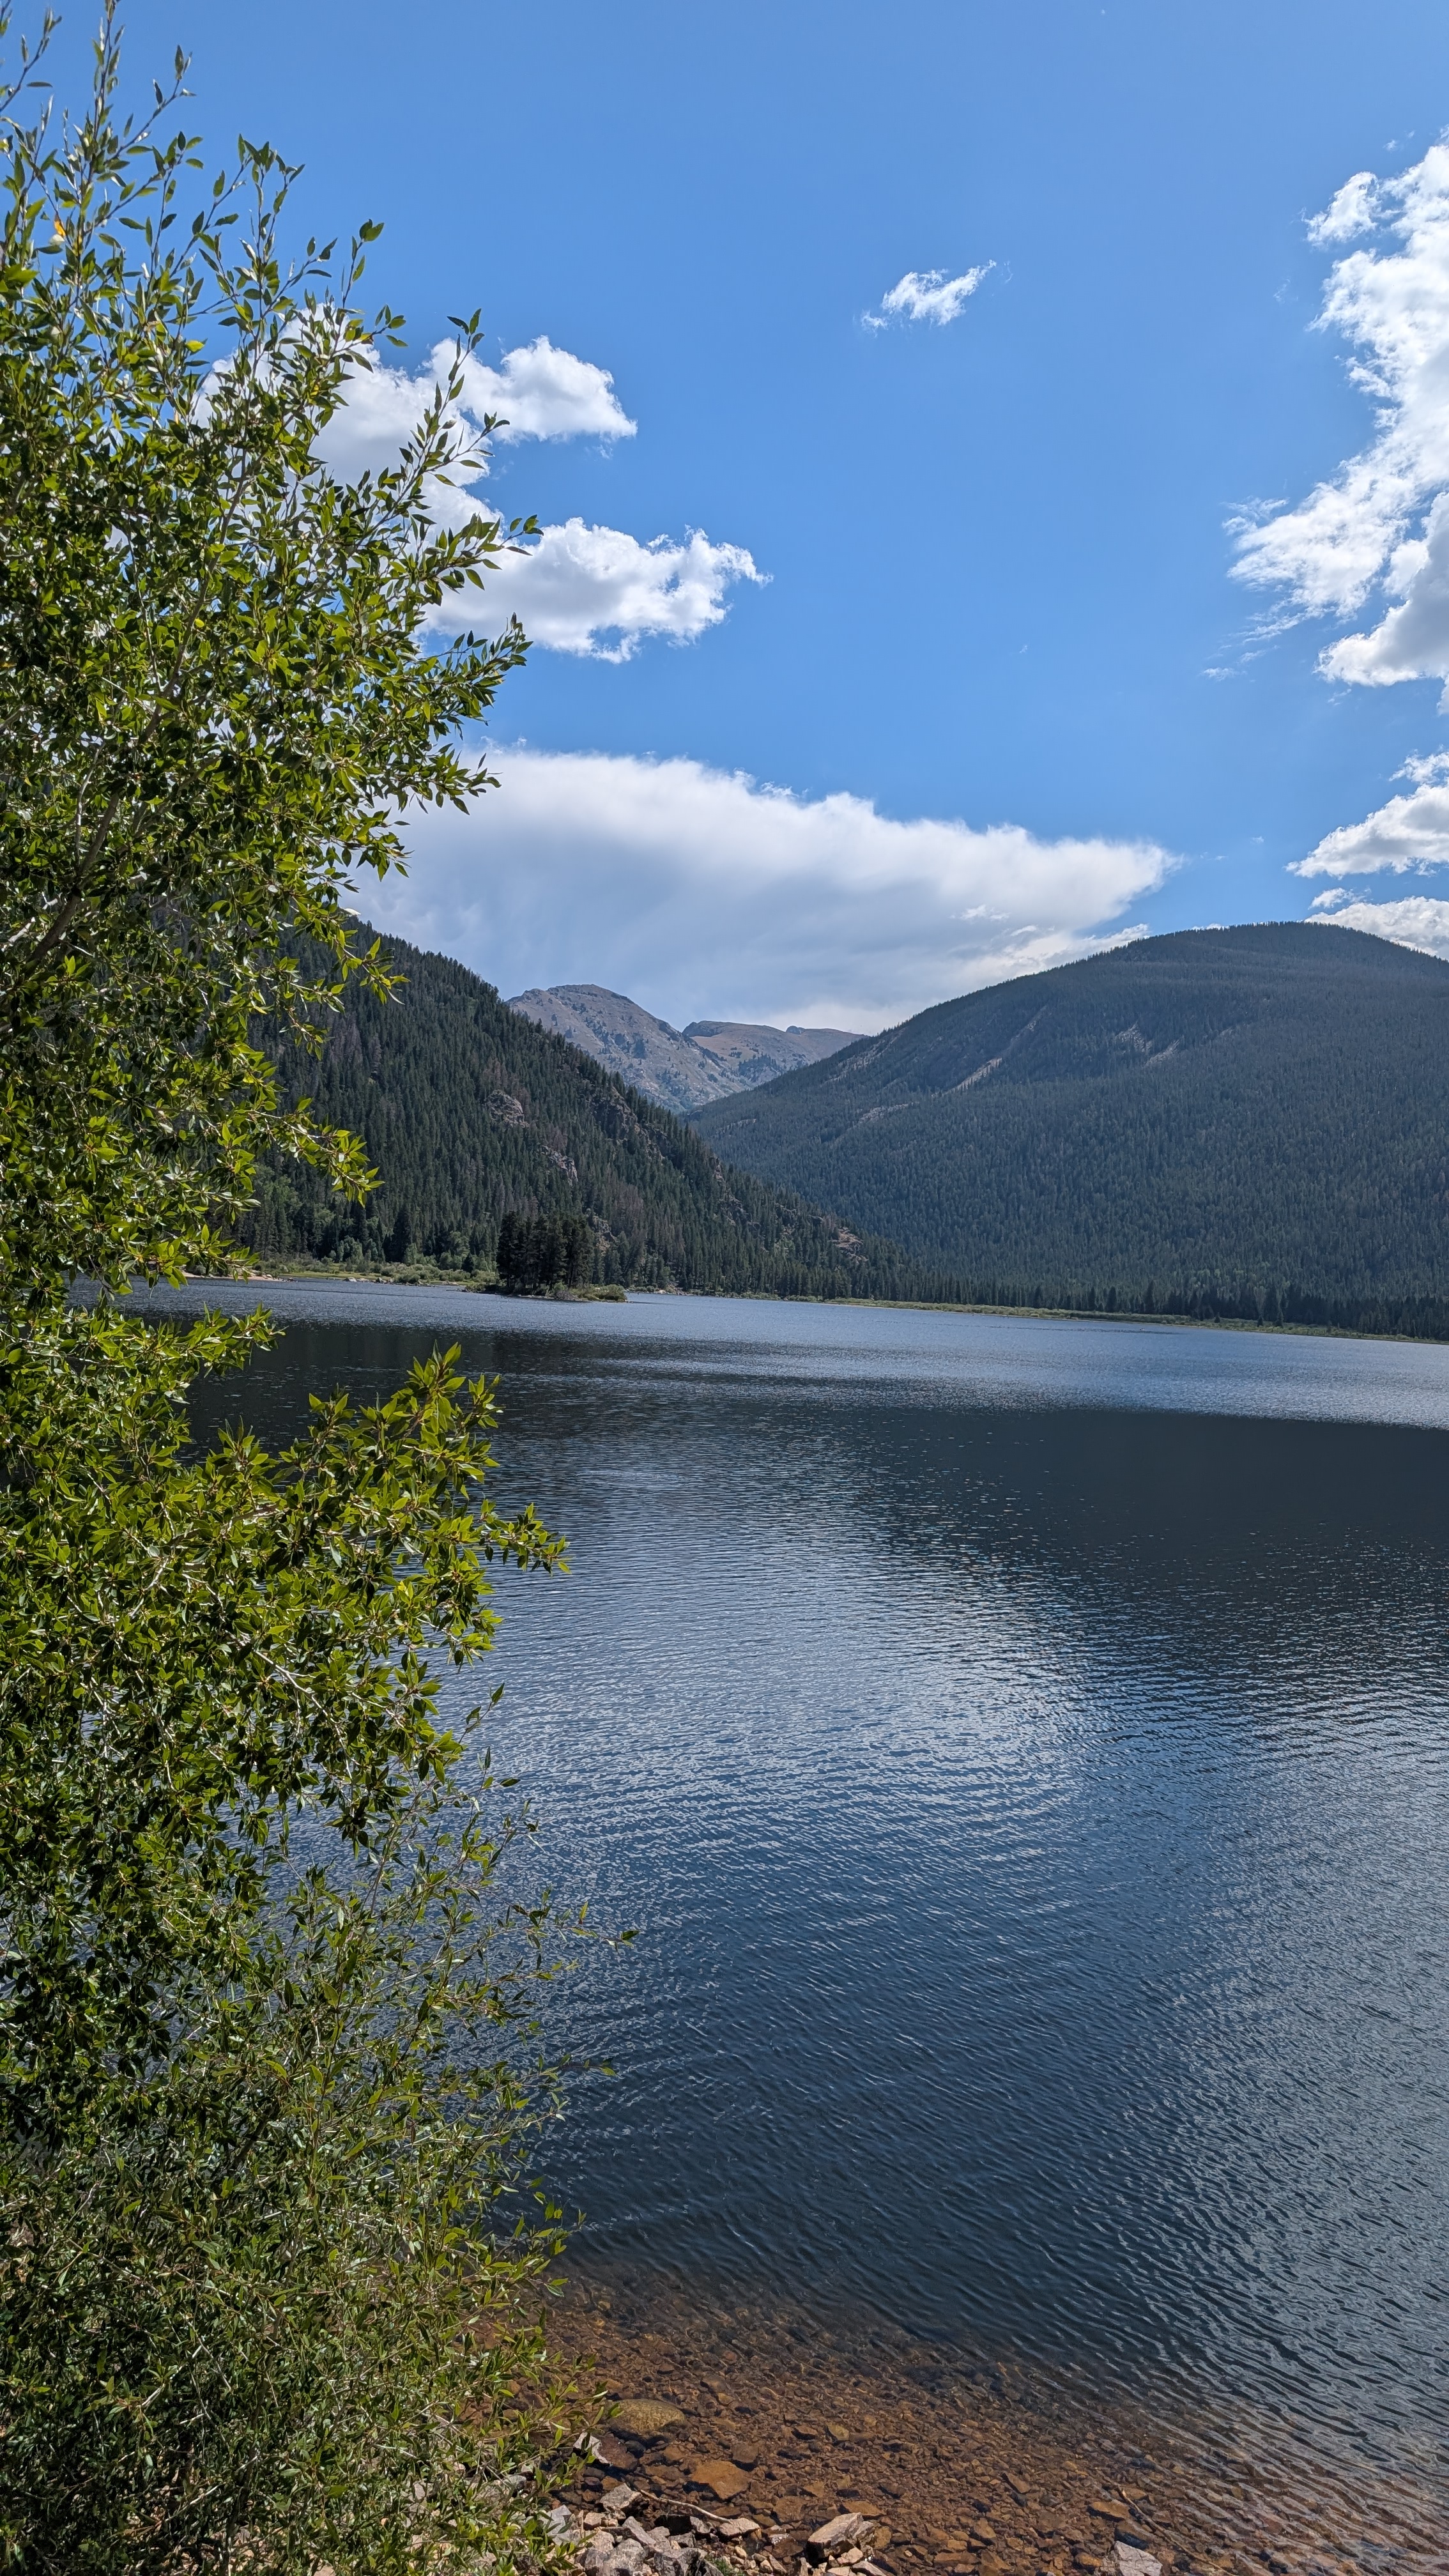
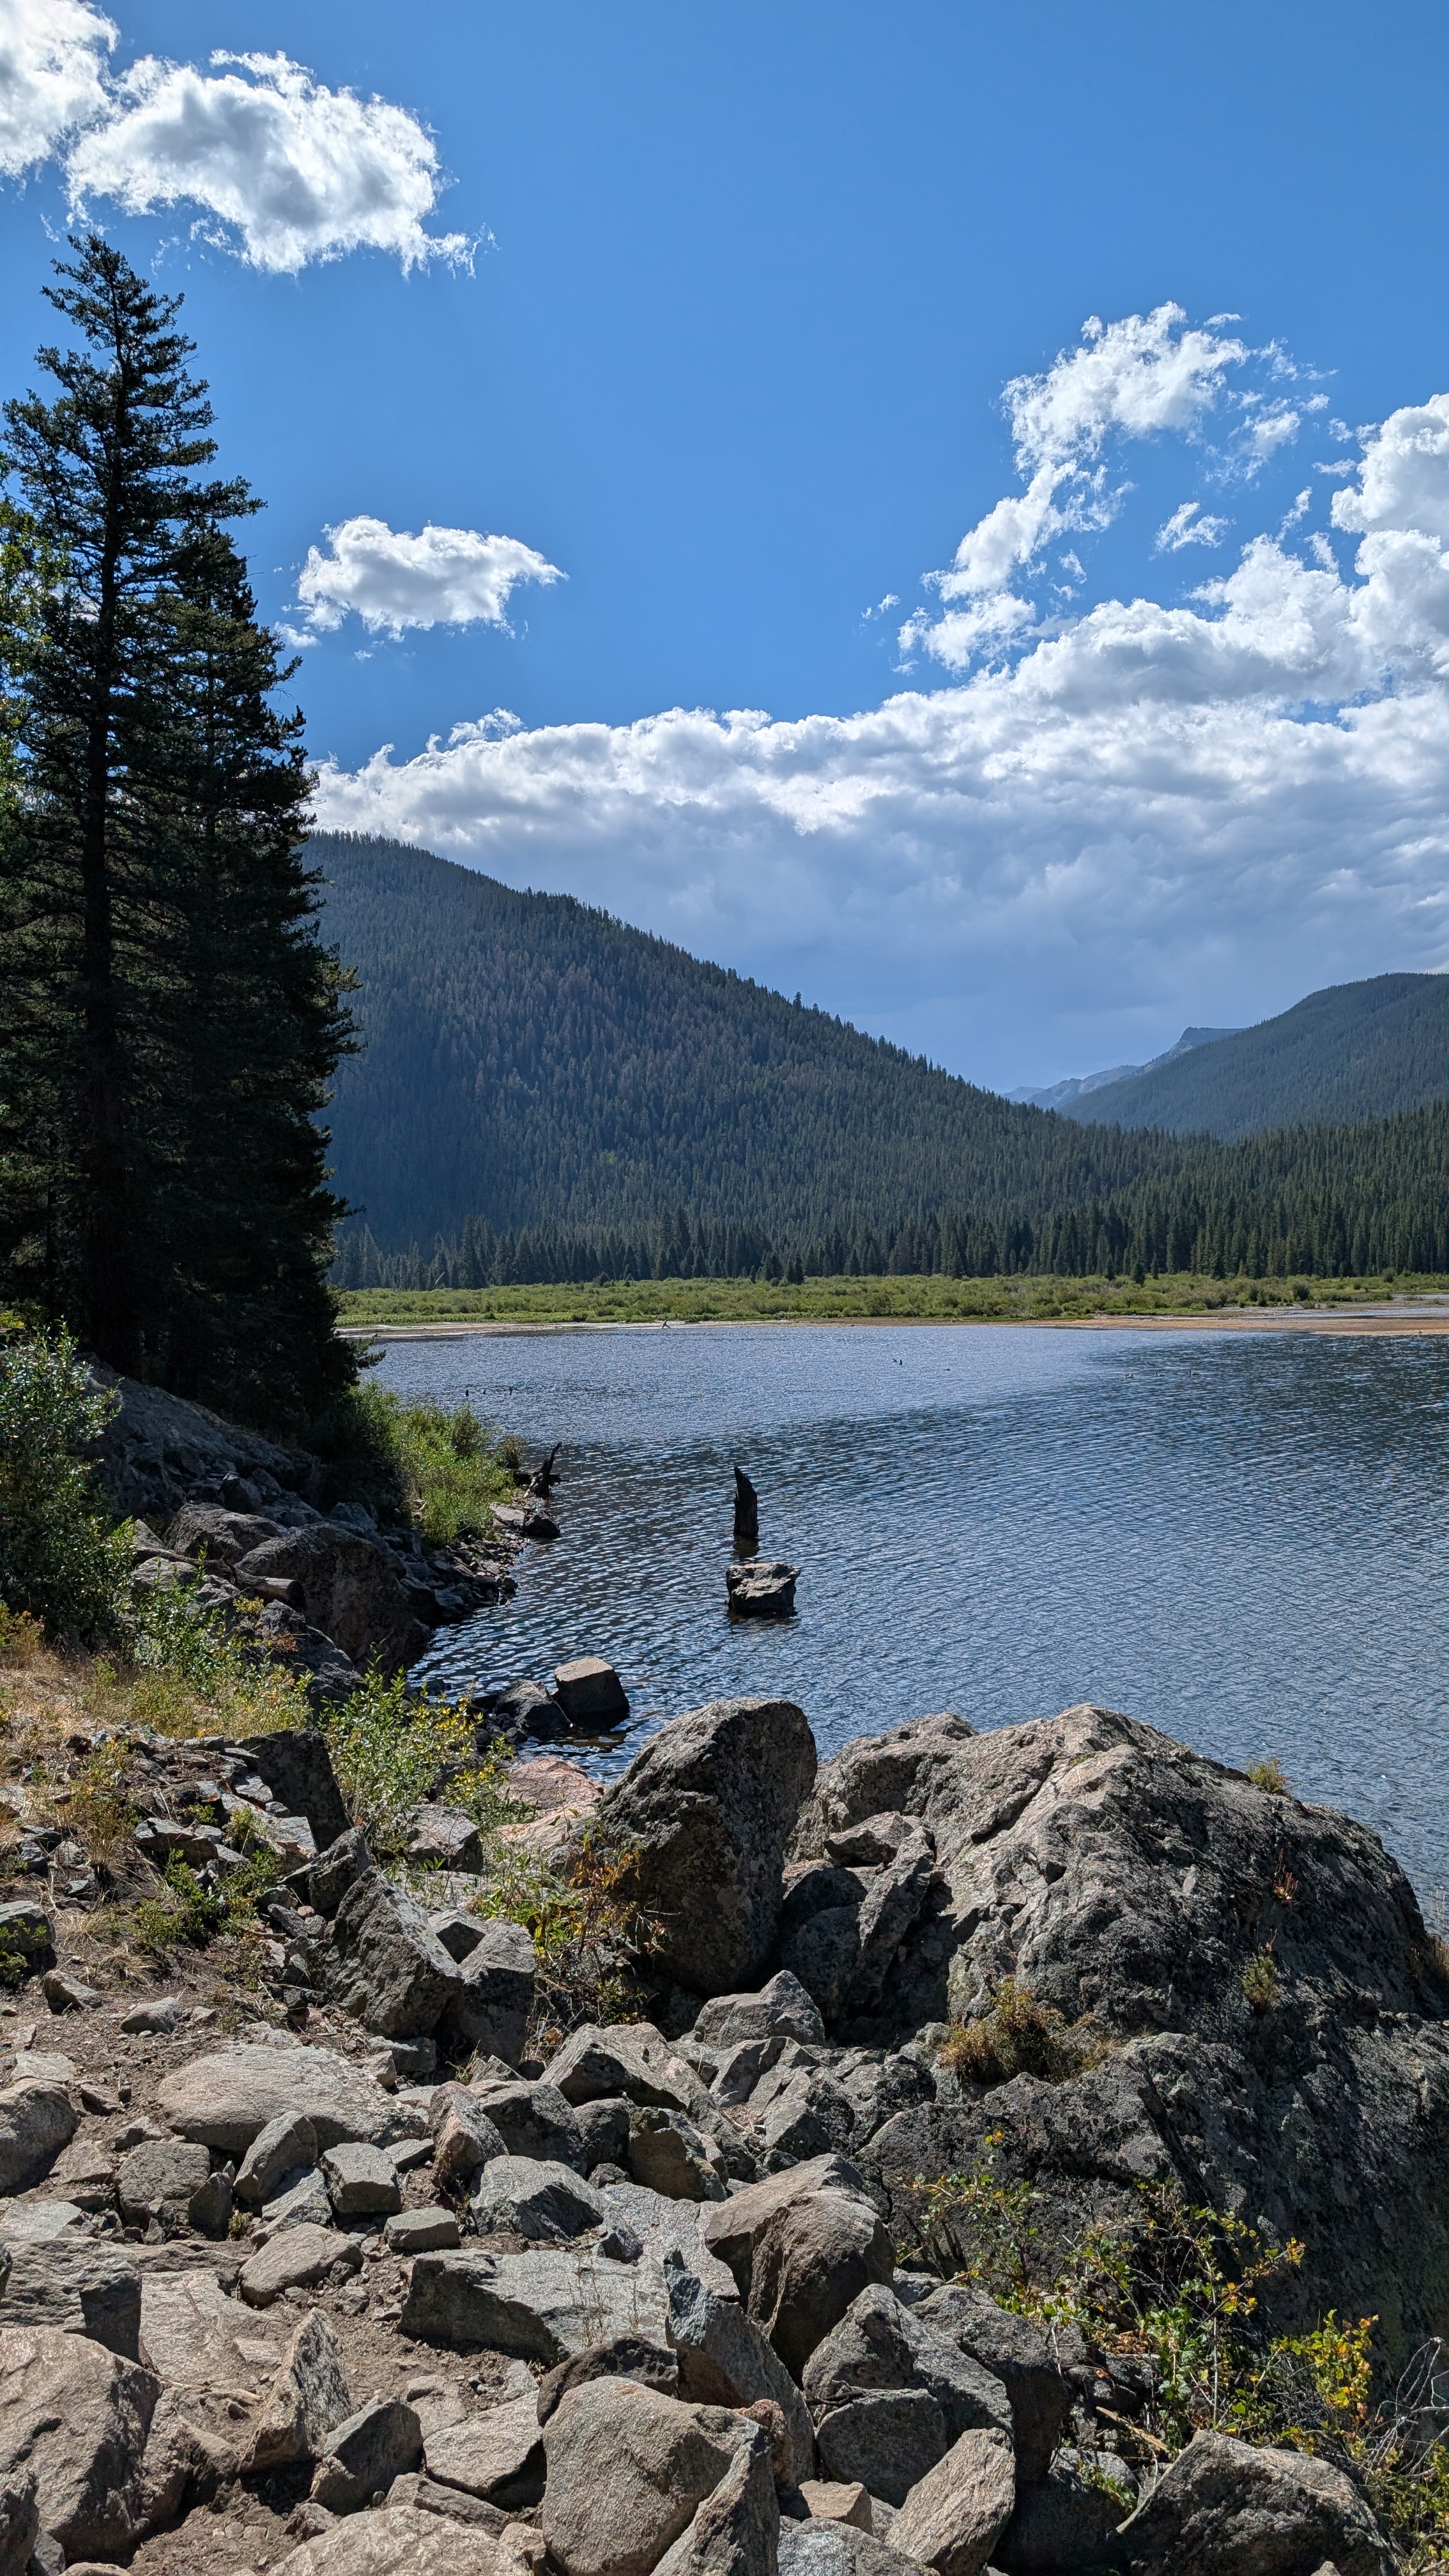
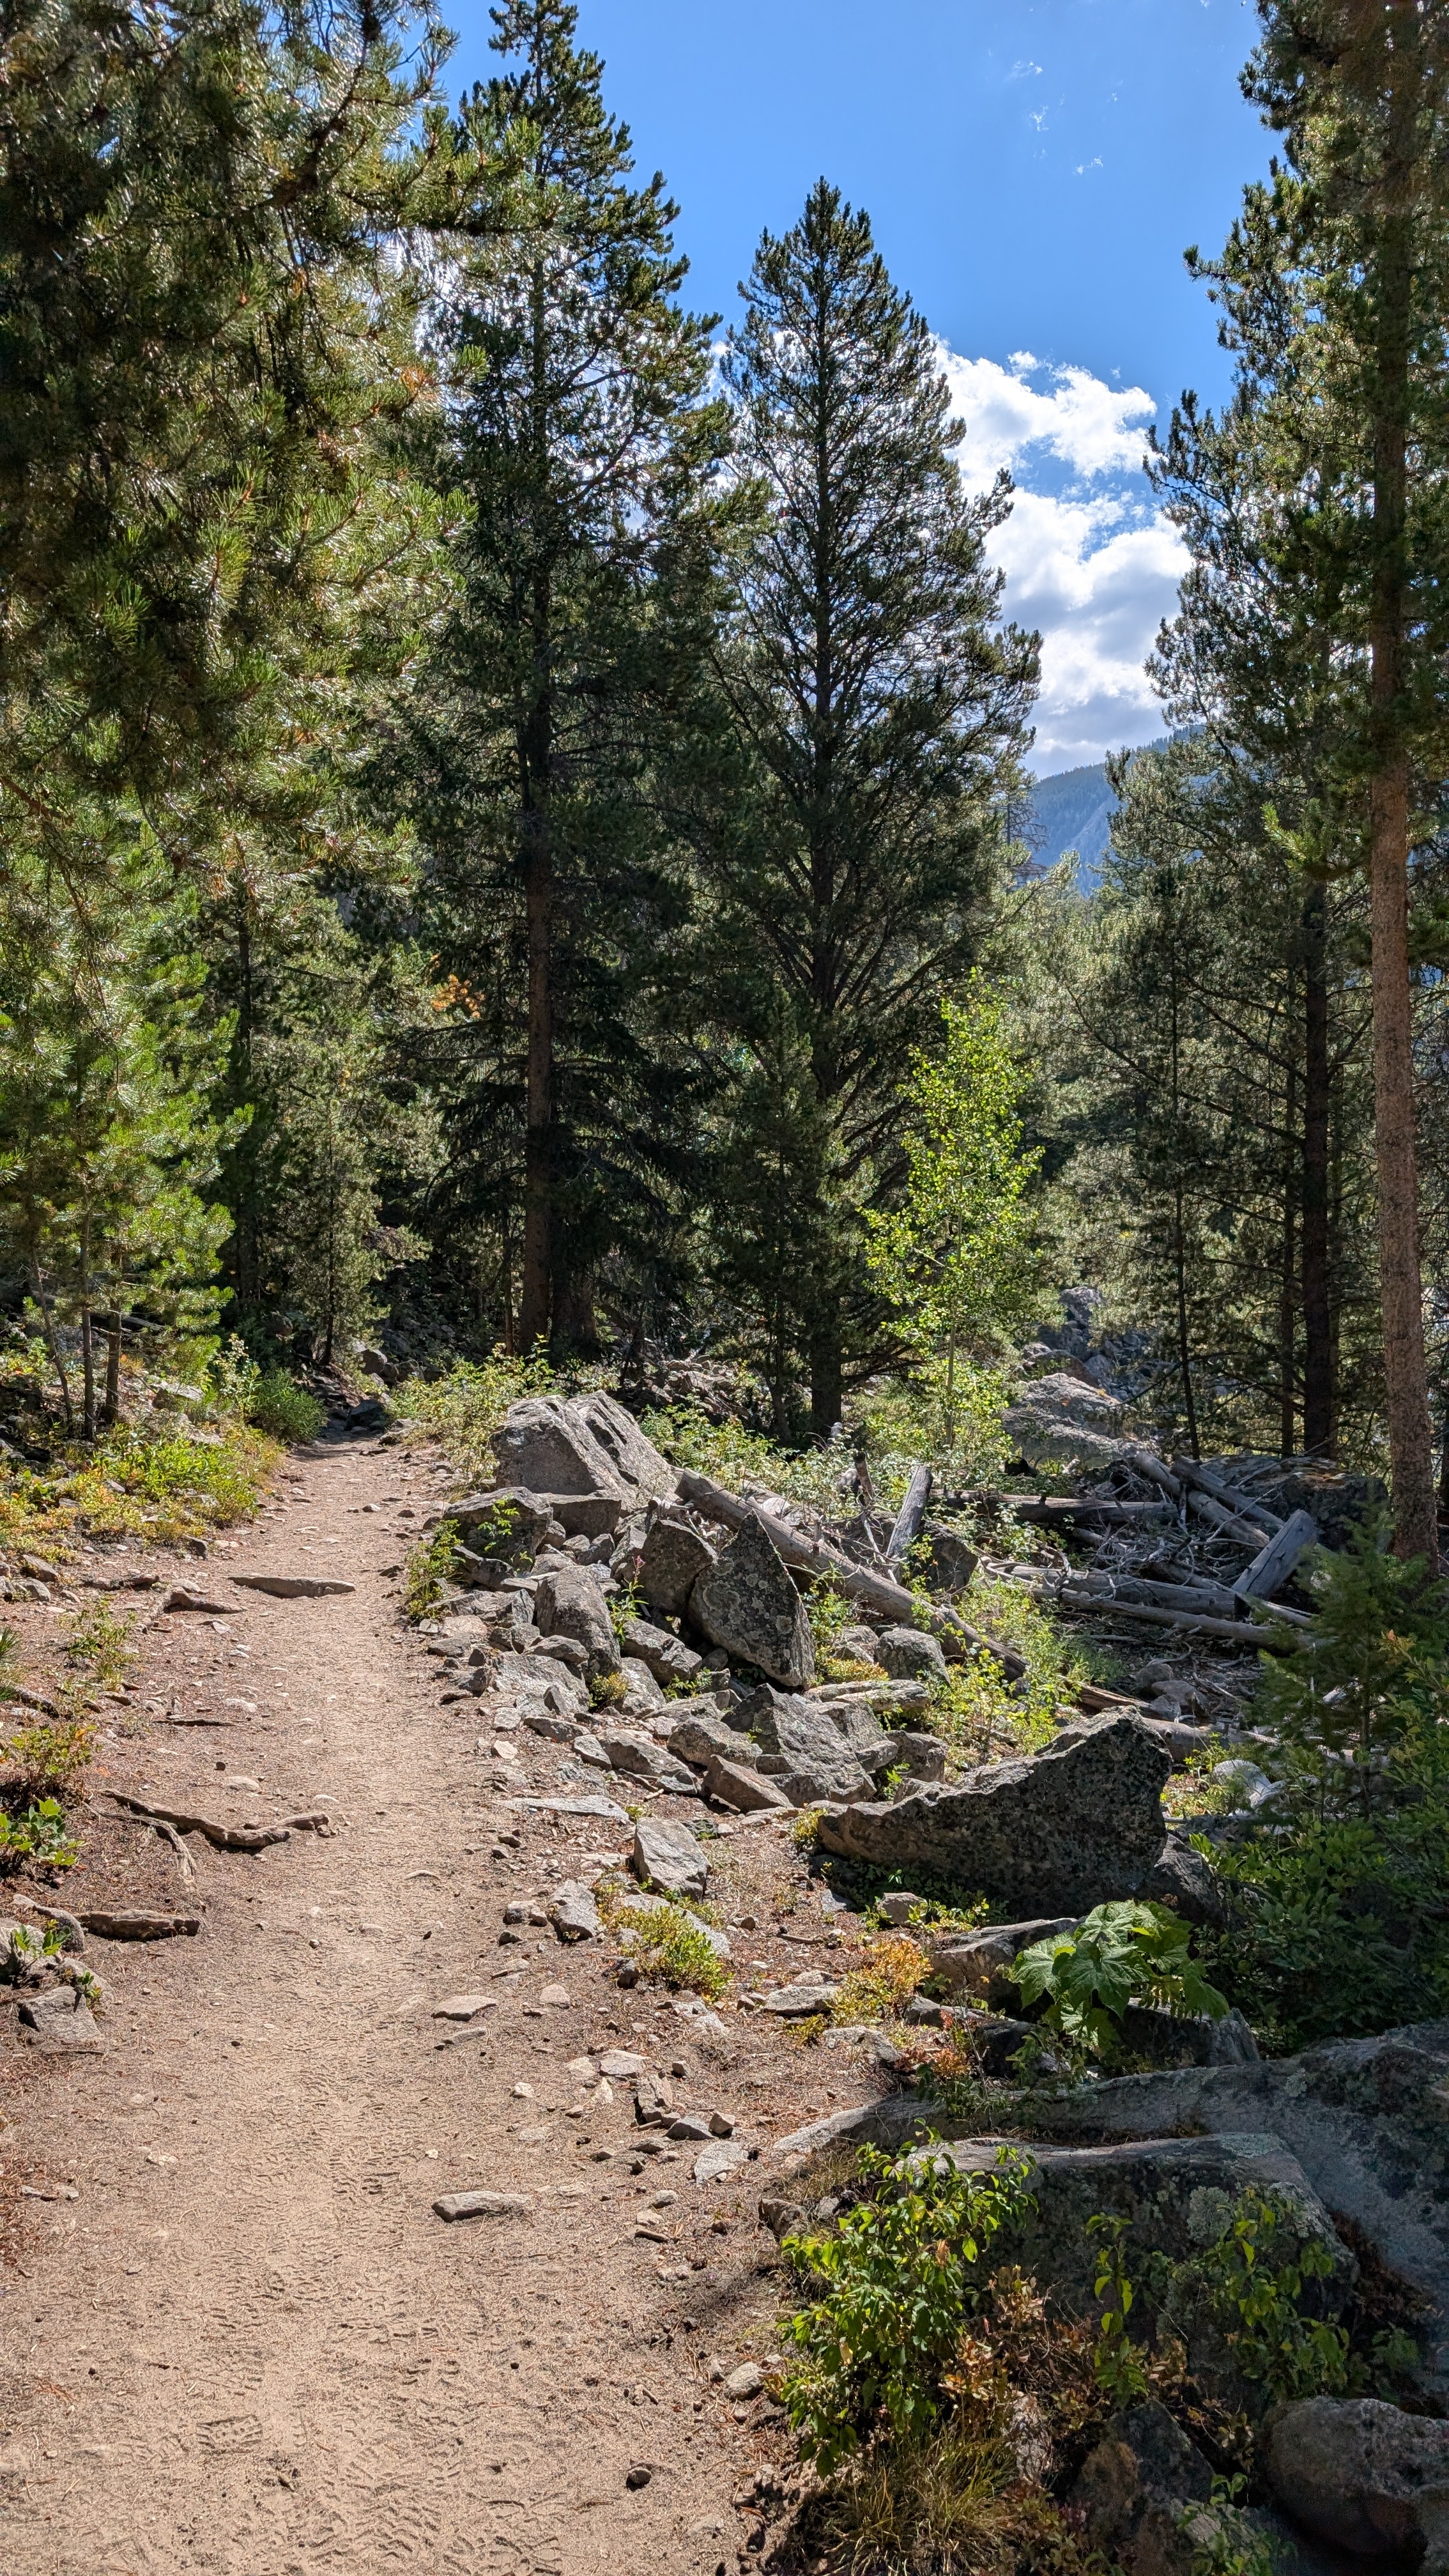
This hike wasn't just exercise — it was a milestone. Being out there alone reminded me of the power of independence. The silence of the forest, the vastness of the mountains, and the rhythm of my footsteps gave me peace and clarity. Taking this hike solo was my own "first step." Just like in Interstellar, sometimes the journey begins when you step into the unknown — and the views at the end are worth it.
A collection of my favorite snow moments — because nothing beats a good snowfall.
Rare snowfall in the Lone Star State — Texas doesn't get snow often, but when it does, it's something special.
Professional network reconnaissance tools — DNS lookup, WHOIS, ping, traceroute, and HTTP header inspection.
Automated log of everything shipped on yashhooda.ai — features, security hardening, pipeline work, and agent activity. Updated continuously.
I'd love to connect! Feel free to reach out to me: